
CRUDE OIL, WTI – Technical Outlook:
- Crude oil’s rally this week may not have legs.
- There is a risk of an extended sideway range.
- What is the rationale and what are the key levels to watch?
Foundational Trading Knowledge
Commodities Trading
Recommended by Manish Jaradi
CRUDE OIL TECHNICAL OUTLOOK – NEUTRAL
It may be premature to be excited about Crude oil’s recovery this week. There is a good chance that the rally could soon run out of steam as the broader range-bound structure remains in force.
Let’s start with the big picture. The overall trend since the 2020 low remains up, though some of the bullishness has faded as reflected in the retreat since mid-2022. On the monthly continuous contract charts, the bearish crossover by the Moving Average Convergence Divergence indicator (MACD) confirms that the medium-term upward pressure has faded (but not reversed). Bearish crossovers in positive territory are a sign that bullishness is easing, but not bearish (See chart), and vice versa.
Crude Oil Monthly Chart
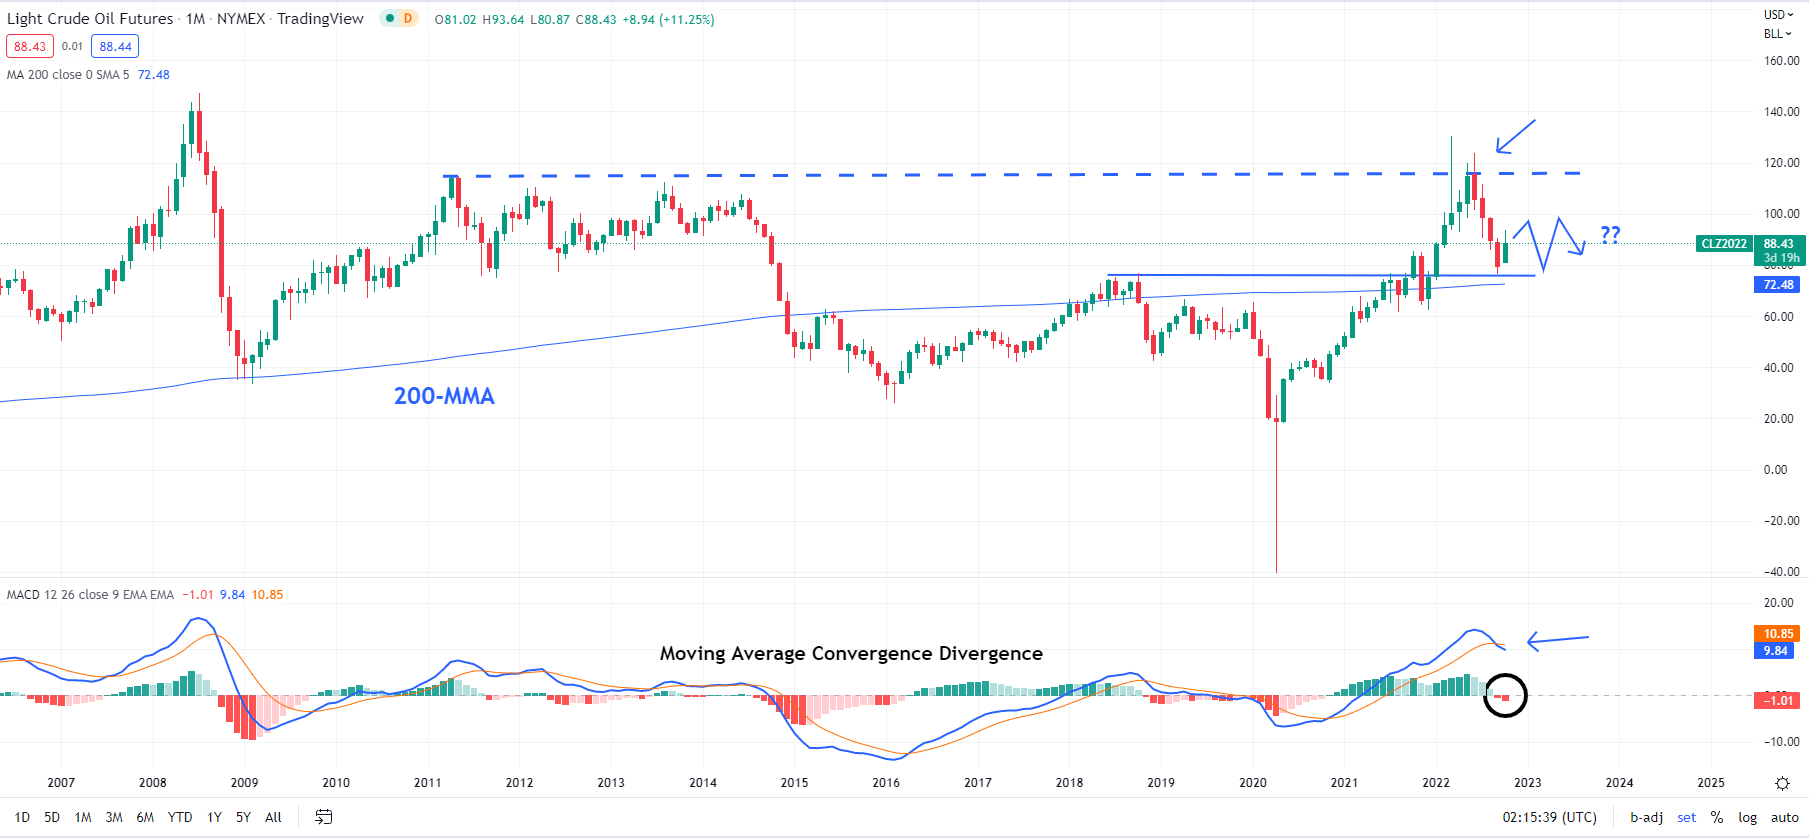
Chart Created Using TradingView
Furthermore, despite the sharp retreat in recent months, oil is holding above crucial support on the 200-month moving average and the October 2018 high of 76.90, slightly above the December 2021 low of 62.45. The implication is that on its own the sharp retreat is not sufficient to conclude that the medium-term uptrend is over. Indeed, beyond any short-term consolidation, the bias remains up. However, for the bullish bias to be reaffirmed, oil will need to break above 97-98 resistance (including the 200-day moving average and the August high of 97.65).
Crude Oil Daily Chart
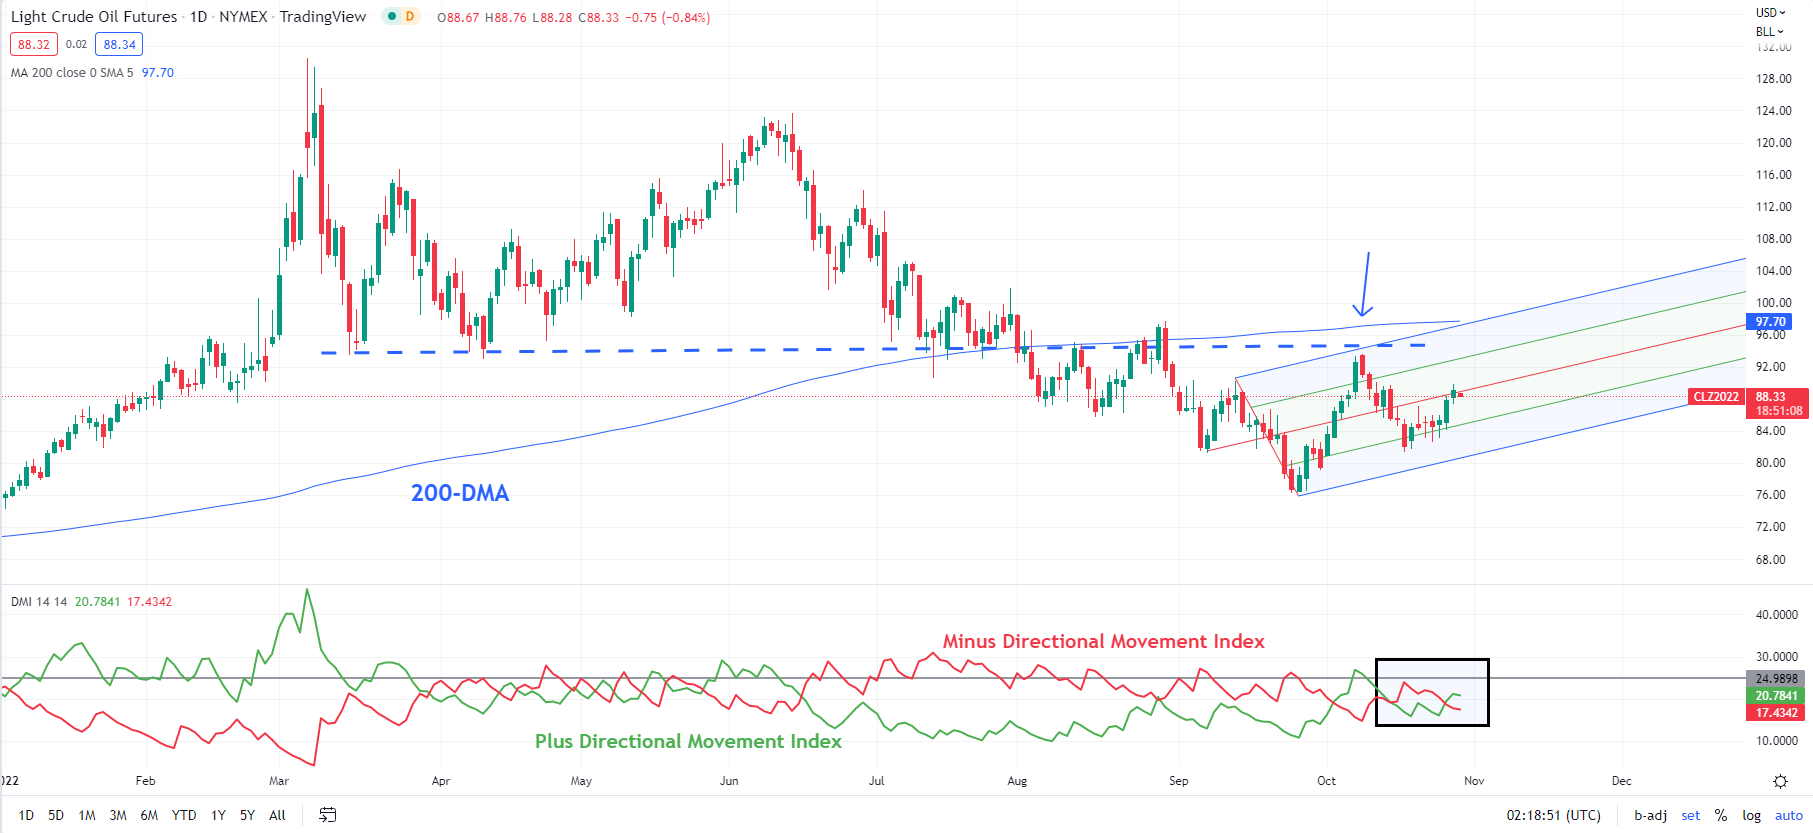
Chart Created Using TradingView
Meanwhile, on the daily charts, the Plus Directional Movement Index (DMI) and Minus Directional Movement Index, a measure of trend direction, are under the 25 mark, indicating the lack of a direction. Typically, in a rising market, the Plus DMI tends to be above 25; in a bearish market, the Minus DMI tends to be above 25. When both Plus DMI and Minus DMI are under 25, it indicates a sideway market. On the downside, there is immediate support at the September low of 76.25. Stronger support is on the 200-week moving average (now at about 64.00).
Recommended by Manish Jaradi
Get Your Free Oil Forecast
— Written by Manish Jaradi, Strategist for DailyFX.com
Read More:No Reason to Be Excited for Hopes of a Recovery
2022-10-29 15:00:00