
- Euro centric woes intensify as inflation breaches 10%, gas supplies reamin in doubt and growth slows.
- The dollar on the other hand stands to beneifit from rate differential and safe haven bid.
- EUR/USD showing no signs of bullish intent, bearish continuation remians constructive
Recommended by Richard Snow
Download the Full EUR Q4 Forecast!
EUR/USD Hinting at a Bottom?
EUR/USD is an FX pair that has not fared well since the invasion of Ukraine in February this year, but truth be told, the euro has been struggling against the dollar even before then.
EUR/USD maintains its multi-year downtrend, but signs of change are appearing. You’ll notice the down sloping pitchfork contained upside breakouts from appearing rather consistently while price action occasionally pierced the lower bound – although, such moves recovered rather quickly as prices moved back within the channel. This suggested the pace of the decline was stronger than any bullish momentum.
The monthly candle for September, however, reveals the first signs of a slowdown in the pace of price declines which may be symptomatic of a period of consolidation as EUR/USD hovers above and below the significant psychological level of 1:1, or parity. In addition, the most recent low appeared closer to the mid-line than prior lows, another suggestion that the bearish momentum may be slowing.
With this in mind, it is constructive to remain focused on the current downtrend. Lower highs and lower lows dictate that there are more sellers of EUR/USD than buyers. Trying to fight the crowd is a risky and often painful experience. Despite breaching the channel to the upside, we have seen prices recover quickly with a rejection of higher prices – evidenced by the upper wick – and a push back below parity.
Weekly EUR/USD Chart: Downtrend Remains
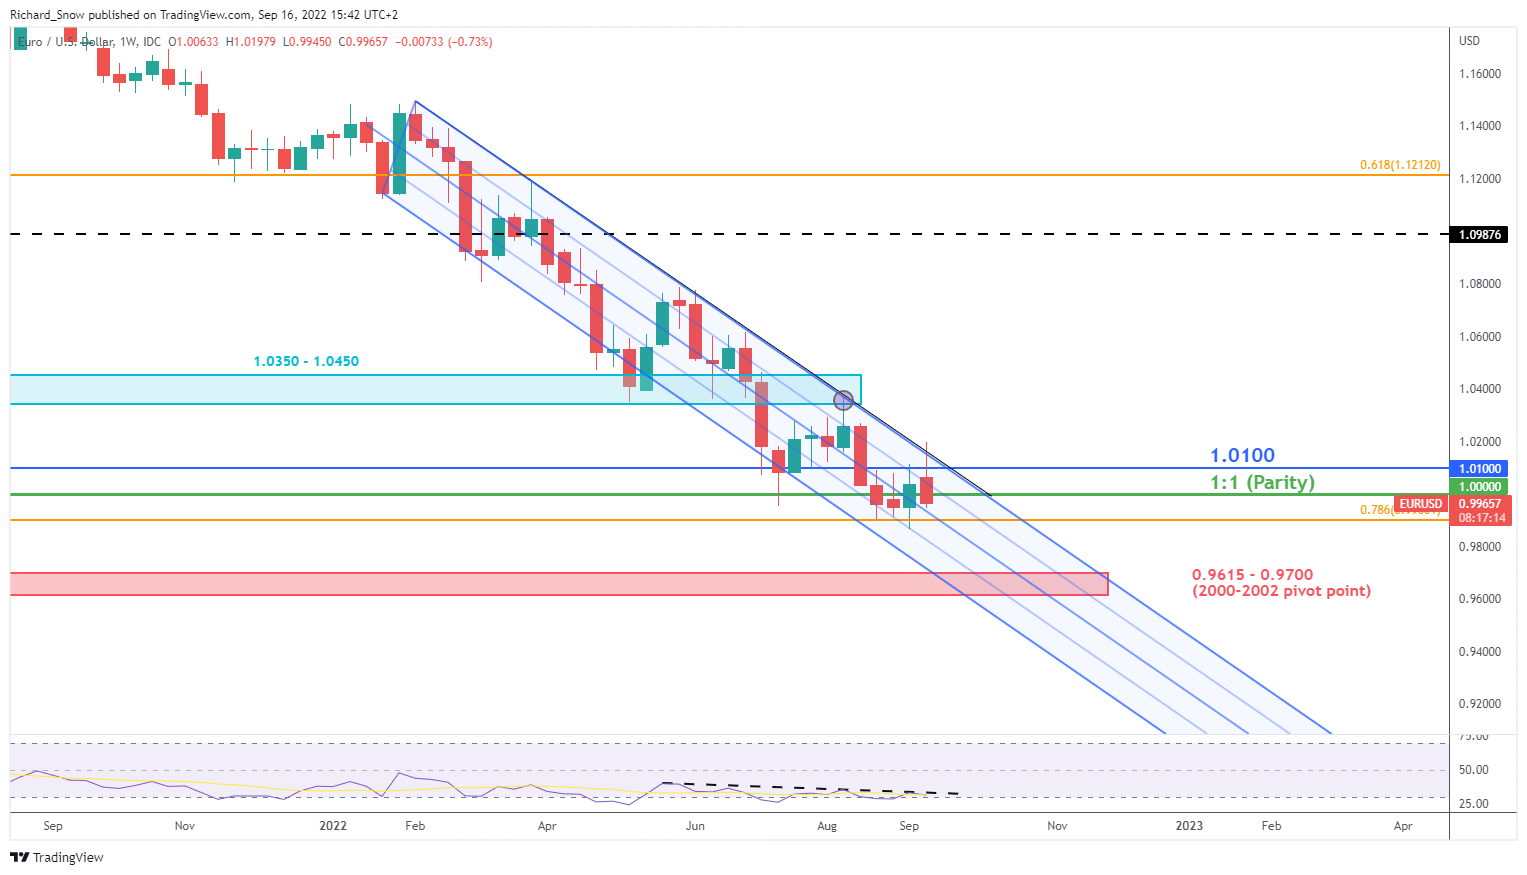
Source: TradingView, prepared by Richard Snow
EUR/USD Technical Forecast: Bearish
The daily chart puts the guidance from last quarter into perspective. In May and June, it appeared as if EUR/USD was establishing a double bottom pattern but was ultimately stopped short at the upper bound of the descending channel. Since then, the pair has dropped around 470 pips after breaking below 1.0340, to mark the recent low.
Price action wasn’t all one-sided however, the ECB’s hawkish rate hike surprise in July propelled the pair right back to 1.0340 – the double bottom level – before bears took control again. With the ECB motivated to continue hiking we could see the pair start to level out around parity, but such a scenario is dependent on the path of the Fed and the ECB.
The base case for Q4 involves a bearish continuation. Apart from parity, the 0.9900 level – which doubles up as the 78.6% Fibonacci retracement of the major 2000 to 2008 move – has acted as recent support. A break and retest of 0.9900, this time as resistance, points to a move towards 0.9700. The broad range of 0.9615 – 0.9700 proved to be a major pivot zone for prices between 2000 and 2002.
EUR/USD Daily Chart: Bearish Trend Remains Intact

Source: TradingView, prepared by Richard Snow
The bearish continuation is invalidated at 1.0280, at which point the bearish bias would need to be reevaluated.
Trade Smarter – Sign up for the DailyFX Newsletter
Receive timely and compelling market commentary from the DailyFX team
Subscribe to Newsletter
Read More:Euro Q4 2022 Technical Forecast: EUR/USD Bearish Continuation
2022-10-02 10:30:33