
Japanese Yen, USD/JPY, EUR/JPY, AUD/JPY, CAD/JPY – Technical Forecast
USD/JPY Technical Outlook – Bullish
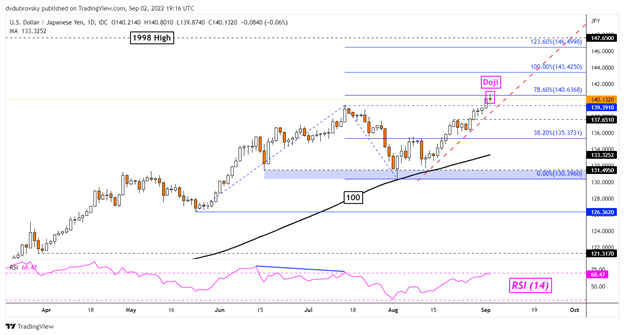
The US Dollar pushed to a new high against the Japanese Yen this year, leaving USD/JPY at levels last seen in 1998. Prices confirmed a breakout above 139.391 – the previous 2022 peak from July. But, a Doji candlestick pattern was left behind. While not necessarily a reversal warning, it typically is a sign of indecision.
Further upside confirmation would help solidify the breakout, especially if prices can clear the 78.6% Fibonacci extension at 140.636. That would subsequently expose the 100% level at 143.425, leaving the pair facing the 1998 peak at 147.65. In the event of a turn lower, keep a close eye on a near-term rising trendline from early August. Below that is the 100-day Simple Moving Average (SMA).
Daily Chart
EUR/JPY Technical Outlook – Slightly Bullish
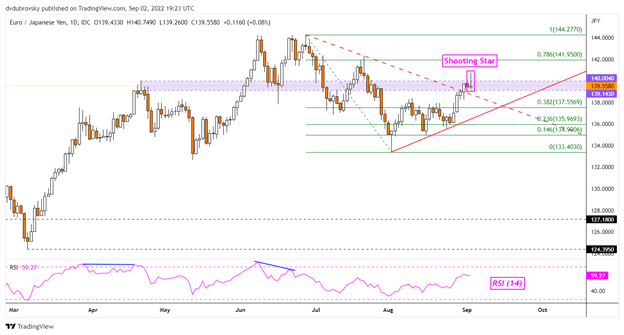
The Euro pushed higher against the Japanese Yen last week, with EUR/JPY closing at its highest since the middle of July. Prices also pushed above the falling trendline from June. However, prices left behind a Shooting Star candlestick pattern. This is a sign of indecision. Further downside confirmation could open the door to extending losses towards the rising trendline from August. Otherwise, confirming a breakout above the 139.143 – 140.004 inflection zone exposes the 78.6% Fibonacci retracement level at 141.95.
Daily Chart
AUD/JPY Technical Outlook – Neutral
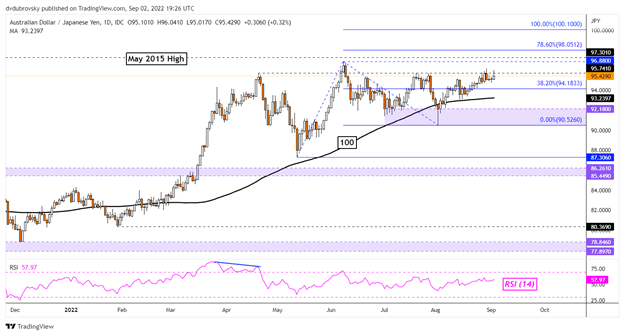
The Australian Dollar marked time against the Japanese Yen this past week, with prices unable to clear the 95.741 inflection point. That has reinforced this price as resistance. A turn lower has immediate support as the 38.2% Fibonacci extension ta 94.183. Further losses would leave the pair facing the 100-day SMA. Clearing this line could offer an increasingly bearish outlook. Otherwise, passing resistance would open the door to revisiting the June peak at 96.88 as well as a more bullish purview.
Daily Chart
CAD/JPY Technical Outlook – Neutral
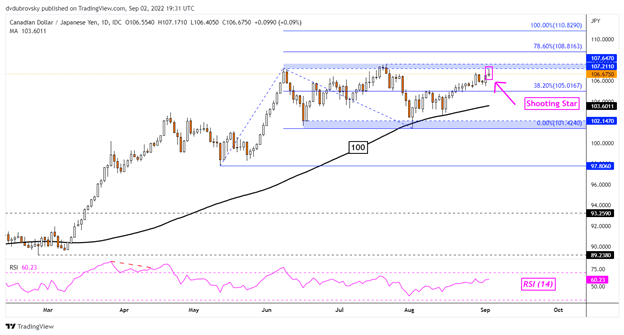
The Canadian Dollar just barely inched higher against the Japanese Yen this past week. But, CAD/JPY remains contained under the 107.21 – 107.64 resistance zone as prices left behind a Shooting Star candlestick pattern. The latter is a sign of indecision. A turn lower would place the focus on the 38.2% Fibonacci extension at 105.01 before the 100-day SMA comes into view. Below that is the 101.42 – 102.14 support zone. Since June, CAD/JPY has been consolidating between 101.42 and 107.64. Until a breakout is achieved in either direction, the outlook remains neutral. Clearing resistance exposes the 78.6% extension at 108.81 before the 100% level nears at 110.82.
Daily Chart
— Written by Daniel Dubrovsky, Strategist for DailyFX.com
To contact Daniel, use the comments section below or @ddubrovskyFX on Twitter
Read More:USD/JPY, EUR/JPY, AUD/JPY, CAD/JPY Prepare for More Gains?
2022-09-04 03:00:00