
Gold Technical Price Forecast:XAU/USD Weekly Trade Levels
Gold prices rallied just over 1% this week with XAU/USD responding to a key technical range we’ve been tracking for weeks now. Stronger than anticipated headline inflation data on Friday was the catalyst for the recent surge in price and we’re looking possible follow through heading into next week. These are the updated targets and invalidation levels that matter on the XAU/USD weekly technical price chart. Review my latest Weekly Strategy Webinarfor an in-depth breakdown of thisgold technical setup and more.
Gold Price Chart – XAU/USD Weekly
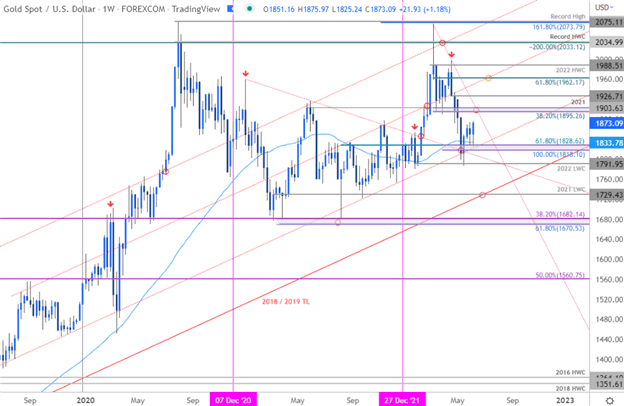
Chart Prepared by Michael Boutros, Technical Strategist; Gold on Tradingview
Notes: In my last Gold Weekly PriceOutlook we noted that XAU/USD was trading just above, “key technical support and the focus into the start of June is on continued inflection off the 1818/33 zone.” This region is defined by the 100% extension of the yearly decline, the 61.8% Fibonacci retracement of the 2021 rally and the 52-week moving average – note that a parallel of the 2018/2019 trendline also converges on this threshold and further highlights the technical significance of this key zone. Gold tested this region again this week before reversing sharply on Friday with price poised to mark an outside weekly reversal off the lows.
Initial weekly resistance & medium-term bearish invalidation steady at the 38.2% retracement / 2021 high-close at 1895-1903 – a breach / weekly close above this threshold would be needed to suggest a more significant reversal is underway with such a scenario exposing the April high-week reversal close (outside-week) at 1926 and the 61.8% retracement of the March decline at 1962. A break / weekly close below 1818 would threaten another accelerated decline towards the yearly low-week close at 1791 and the next key support level at the 2021 low-week close at 1729.
Bottom line: Gold defended medium-term support at 1818/33 for a second time with an outside-weekly reversal off the lows (and an outside daily reversal on Friday) further defining this key threshold. The focus remains on inflection off this zone with the medium-term risk weighted to the topside while above. From a trading standpoint, losses should be limited to this week’s low IF price is indeed heading higher – look for a reaction on stretch towards 1900 IF reached for guidance. Review my latest Gold Price Outlook for a closer look at the near-term XAU/USD technical trade levels.
For a complete breakdown of Michael’s trading strategy, review his Foundations of Technical Analysis series on Building a Trading Strategy
Gold Trader Sentiment – XAU/USD Price Chart
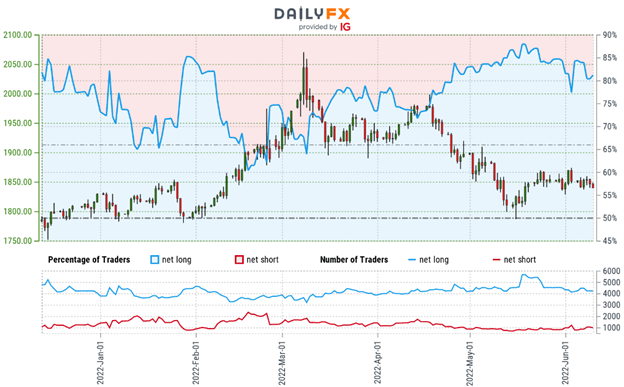
- A summary of IG Client Sentiment shows traders are net-long Gold- the ratio stands at +4.20 (80.78% of traders are long) – typically bearishreading
- Long positions are0.69% lower than yesterday and 2.95% higher from last week
- Short positions are 0.29% lower than yesterday and 14.37% lower from last week
- We typically take a contrarian view to crowd sentiment, and the fact traders are net-long suggests Gold prices may continue to fall. Traders are less net-long than yesterday but more net-long from last week. The combination of current positioning and recent changes gives us a further mixed Gold trading bias from a sentiment standpoint.
—
Active Weekly Technical Charts
– Written by Michael Boutros, Technical Strategist with DailyFX
Follow Michael on Twitter @MBForex
Read More:Hot Inflation Sparks Gold Reversal
2022-06-10 20:00:00