
Tsuji/E+ via Getty Images
Every week, we look at 29 currencies in search of evidence of popular delusions and the madness of crowds. The idea is to find anomalies and bullish or bearish divergences that will either break the trend or prolong it. It’s a painful exercise, but also highly rewarding.
In order to find the most overbought and oversold currencies, we conduct five econometric studies: technical over-extension analysis, secular performance analysis, oil correlation review, economic divergence analysis, and effective exchange rate study. Additionally, we look at traders’ positioning to understand the psychological state of the market.
We hope that the information provided below will help you trade the following instruments:
- Major currency pairs: AUD/USD, EUR/USD, GPB/USD, NZD/USD, USD/CAD, USD/CHF, and USD/JPY.
- Relevant ETFs (single-currency): (FXA), (BTF), (FXF), (FXB), (FXC), (CYB), (FXE), (FXY).
- Leveraged ETFs: (ULE), (EUO), (YCL), (YCS).
- Strategy ETFs: (DBV), (UUP), (UDN), (CEW), (USDU).
Macro Forces
Before revealing the results, let me first say a few words about the current global market environment. This is important because global macro conditions cannot be numerically measured and cannot be directly factored into econometrical models. They must be studied in qualitative terms.
The war in Ukraine is having a significant impact on trade flows – particularly in agricultural commodities. Alongside China lockdowns, bottlenecks look set to worsen in the near term. However, a general cooling in consumption will help to ease pressure on the supply side. Risks to inflation continue to be to the upside.
Key Economics Forecasts
United States
At its May meeting, the FOMC raised the target range of the Fed funds rate by 50bp, to 0.75-1.00%, in line with the consensus expectations. In addition, at the press conference, Chair Powell strongly signaled further such super-sized rate moves, saying that the Committee expected 50bp rises to be considered at the “next couple of meetings.”
US GDP contracted in Q1, by -1.4% q/q annualized, against expectations for a continued expansion in the economy (consensus: +1.0%). The contraction reflects continued supply bottlenecks in Q1, with demand remaining strong.
Eurozone
German factory orders dropped by 4.7% MoM in March, and production fell by 3.9% MoM that month. Both outcomes were well below consensus expectations. The slowdown in Germany’s industrial sector was pre-signaled by falls in Germany’s manufacturing PMI and Ifo business climate in the industry in March-April. Still, there seems to be room for a temporary acceleration in production in the course of this year as large backlogs have built up in recent quarters on the back of supply chain bottlenecks and shortages of labor.
China
Last week, the official PMIs and Caixin’s manufacturing PMI for April were published. The PMIs dropped further below the neutral 50 mark, to the lowest levels since the initial covid-19 shock in Q1-2020. The official manufacturing PMI fell to 47.4 (March: 49.5, consensus: 47.3) and the non-manufacturing PMI to 41.9 (March: 48.4, consensus: 46.0). This brought the official composite PMI to 42.7 (March: 48.8). Caixin’s manufacturing PMI fell to 46.0 (March: 48.1, consensus 47.0). All this clearly reflects the impact of the broadening of lockdowns seen since the second half of March, on the back of the spread of Omicron. This has created heavy headwinds to China’s economic growth and added to domestic supply bottlenecks spilling over to global supply chains.
Main economic/financial forecasts (ABN AMRO Group Economics, Refinitiv, Bloomberg)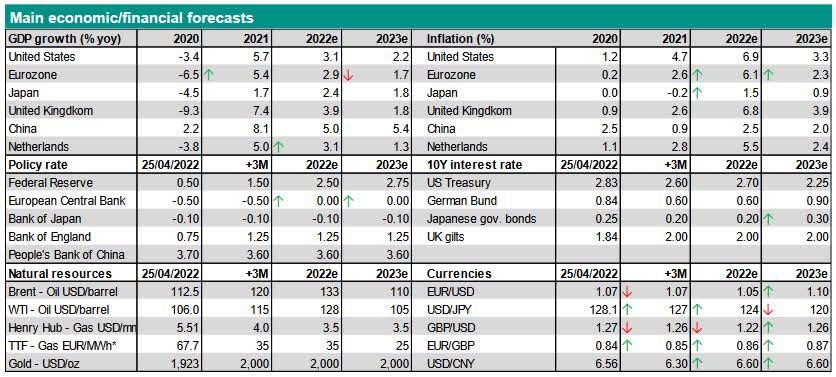
Forex Valuation – Latest Results
Below is the complete Forex Market Summary (as of May 9, 2022) – filtered from the most “overvalued” to the most “undervalued” currencies (see “Dev.” column).
Forex Relative Valuation Summary (Bluegold Trader)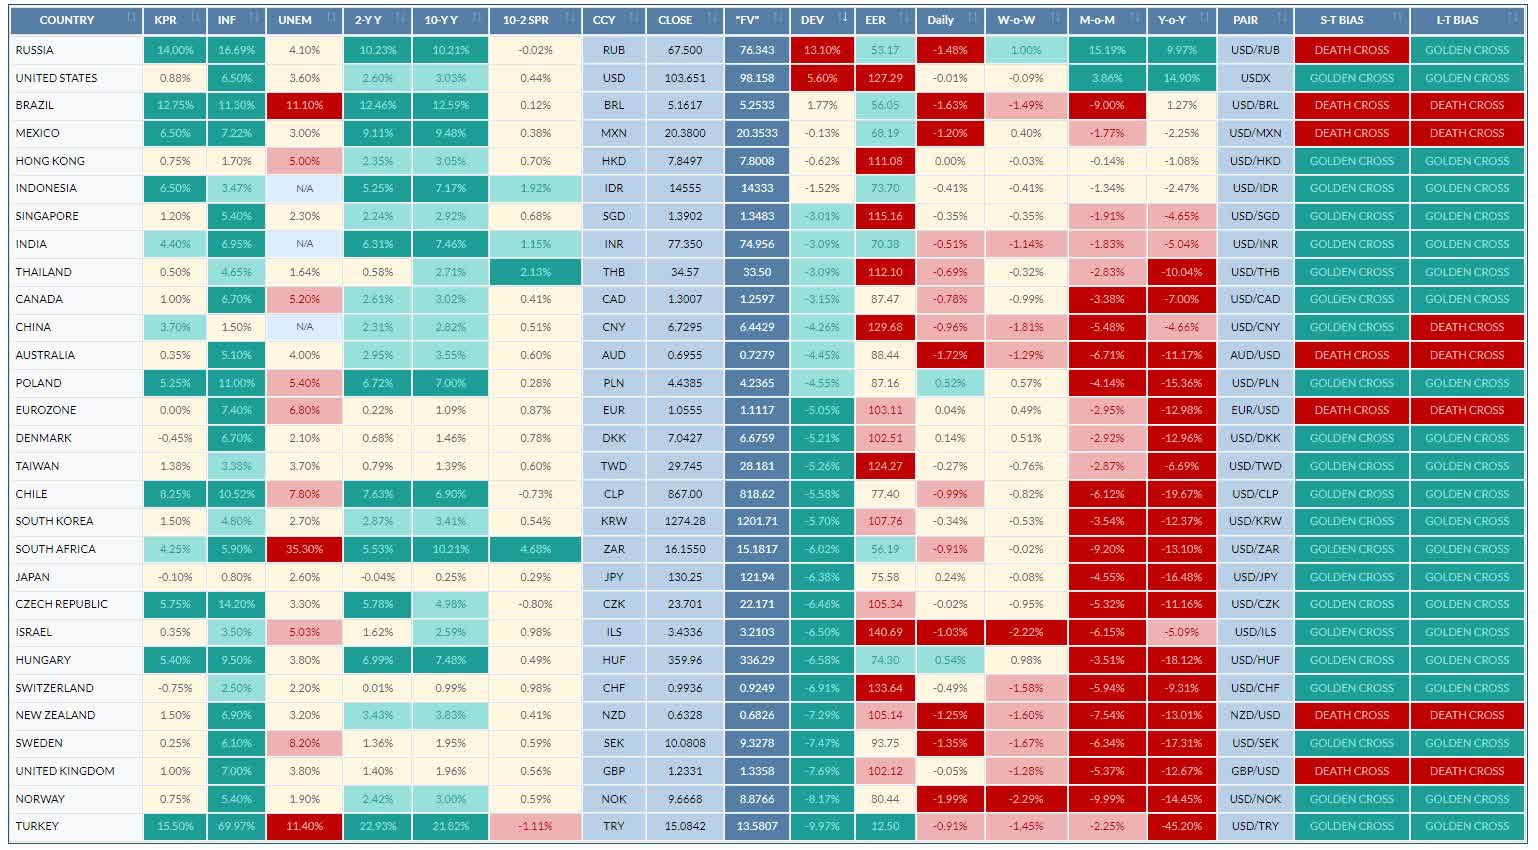
Description:
- KPR – key policy rate.
- INF – inflation.
- UNEM – unemployment.
- 2-Y Y – 2-year yield. The rate of return or interest paid to the bondholder (investor) of a 2-year government bond (yield to maturity, latest close).
- 10-Y Y – 10-year yield. The rate of return or interest paid to the bondholder (investor) of a 10-year government bond (yield to maturity, latest close).
- 10-2 SPR – 2-10 yields spread. The yield spread between the 10-year government bond and the 2-year government bond.
- FV – “FAIR VALUE” – Hypothetical estimation of a fair value based on four econometric studies.
- DEV – DEVIATION – Currency’s exchange rate deviation from the “fair value”.
- EER – effective exchange rate
- GOLDEN CROSS – The golden cross is a candlestick pattern that is a bullish signal in which a relatively short-term moving average crosses above a long-term moving average.
- DEATH CROSS – The death cross is a technical chart pattern indicating the potential for a major selloff. The death cross appears on a chart when a short-term moving average crosses below a long-term moving average.
I will not go through the results of each of the studies, but instead, will illustrate the final ranking. If you want to see the individual results of each of the studies, scroll down to the charts section below.
I have ranked 28 currencies on a scale of -13.0 to +14.0 for each of the studies, where -13.0 indicates “oversold conditions” and +14.0 indicates “overbought conditions.” Therefore, the overall minimum score that any currency can have is -65.0, while the maximum is +70.0.
Forex Relative Valuation (Ranking) (Bluegold Trader)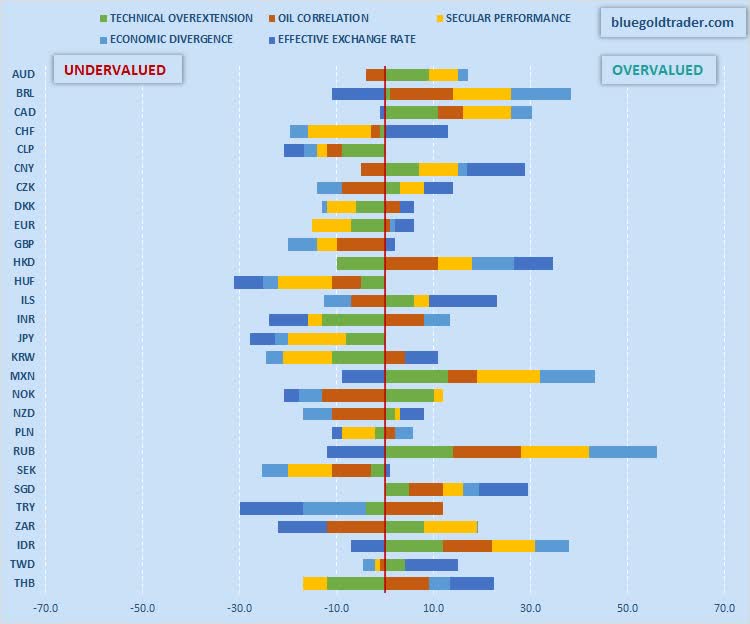
On balance, the Russian Ruble, Mexican Peso, and Singapore dollar appear to be the most “overrated” (or overvalued currencies), with a net score of +44 +34.2, and +29.4, respectively (see the chart above). The Canadian dollar, Brazilian real, and Hong Kong dollar are not far behind, at +29.2, +27.4, and +24.6, respectively. The most “underrated” (or undervalued currencies) are the Hungarian forint (-31.2), Japanese Yen (-27.8), and Swedish krona (-24.4).
When looking solely at the major currencies, we see that the Canadian dollar and Australian dollar stand out among the rest as the most “overvalued” currencies on the basis of all six studies. Conversely, the Japanese yen and the British pound appear to be the most “undervalued” currencies among the majors (see the chart below).
Forex Relative Valuation (Majors Ranking) (Bluegold Trader)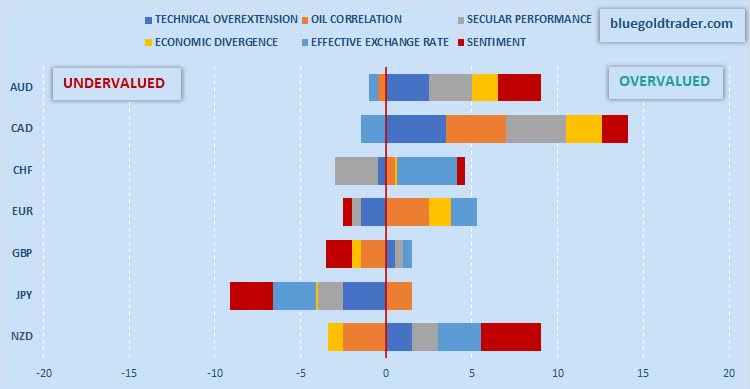
What’s important is that the relative overvaluation of the Canadian dollar is rather broad-based. In other words, the results are above zero for almost all econometric studies. However, the relative undervaluation of the British pound is less extensive.
Now let’s look at econometric studies.
Econometric Studies
Over-Extension Analysis
Technical over-extension analysis ranks the exchange rates in percentages of their respective trading ranges over the past years and allows us to see how far each currency has deviated from its historical (three-year) trading range. I choose to look at the three-year period for several reasons. First of all, it’s long enough to capture more than half of a standard business cycle of most economies (according to the National Bureau of Economic Research, the average length of a business cycle is about 69 months, or a little less than six years). At the same time, a three-year range is short enough to be relevant and not to produce too smoothed-out results. In other words, analytical curves maintain some healthy volatility and tend to generate actionable trading signals.
The most overextended currency is the Canadian dollar. As of last Monday, it was trading at 60.65% of its three-year range. The most lagging currency is the Japanese yen, trading at just 2.1% of its three-year range.
Forex Overextension Analysis (Bluegold Trader)
Oil Correlation
The oil correlation study simply examines the link between a country’s exchange rate and the price of oil. This relationship is quite critical because oil prices serve as an important proxy for future changes in the Consumer Price Index, which influences countries’ macroeconomic policies, which, in turn, affect the exchange rate. Based on the 24-month running oil price standard correlations, I have calculated that all major currencies are “cheap” vs oil but the Canadian dollar is the least undervalued of all (-6.46%). Conversely, the New Zealand dollar is undervalued by 11.07%.
Forex Oil Correlation Analysis (Bluegold Trader)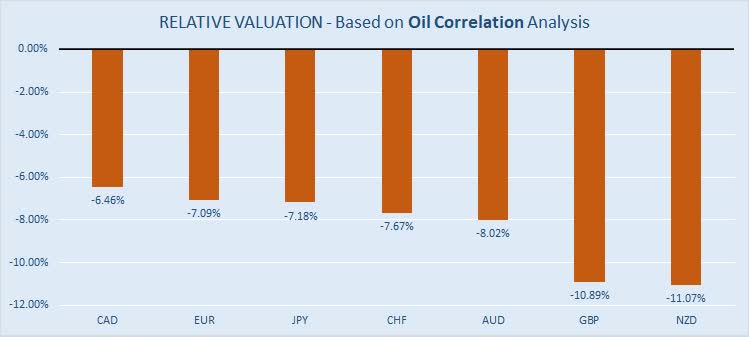
Secular Performance
Assessing the strength of any given currency is quite tricky. Because we usually measure the performance of one currency against the other, the result is always biased. For example, a rising GBP/USD may not necessarily reflect improved fundamentals in the United Kingdom, but rather point to deteriorating fundamentals in the United States. A less-biased approach would be to compare a currency’s performance against some kind of neutral assets, such as gold. Analysts call it a secular performance analysis.
Secular performance is a useful, but underused, a concept in forex trading. It’s an important measure because gold (it’s assumed) has some intrinsic value as opposed to fiat currency, which is just a “legal tender” not backed by any physical commodity. In the end, the price of gold will be determined by supply and demand rather than by central banks’ monetary policy and the printing press. Analyzing currency performance against that of gold allows us to see the scale of “real” demand for this or that currency.
Based on the 24-month running secular performance observations, I have calculated that all major currencies are undervalued vs gold but the Canadian dollar is the least undervalued of all (-0.17%). Conversely, the Swiss franc is undervalued by 6.75%.
Forex Secular Performance Analysis (Bluegold Trader)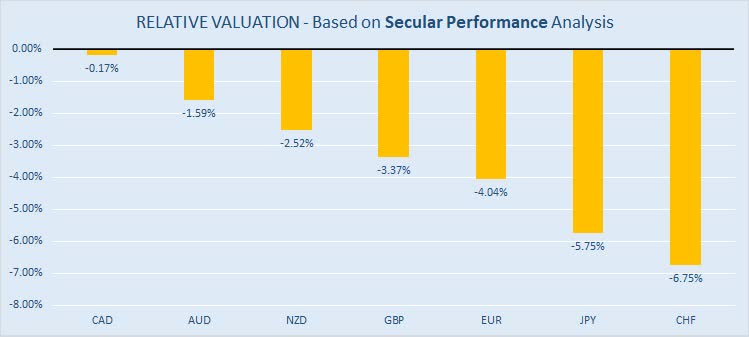
Economic Divergence
As a general rule, economic data should always justify the moves in currencies’ exchange rates. However, it’s difficult (if not downright useless) to cherry-pick a single economic indicator and compare it to a currency’s performance,…
Read More:May 2022: Forex Relative Valuation And Trading Opportunities
2022-05-10 16:09:00