
USD Technical Outlook
- US Dollar Index (DXY) is trading near long-term trend-line
- EUR/USD rejected new lows on Thursday post-ECB
US Dollar Technical Analysis: Watch EUR/USD, Setback Could Be Near
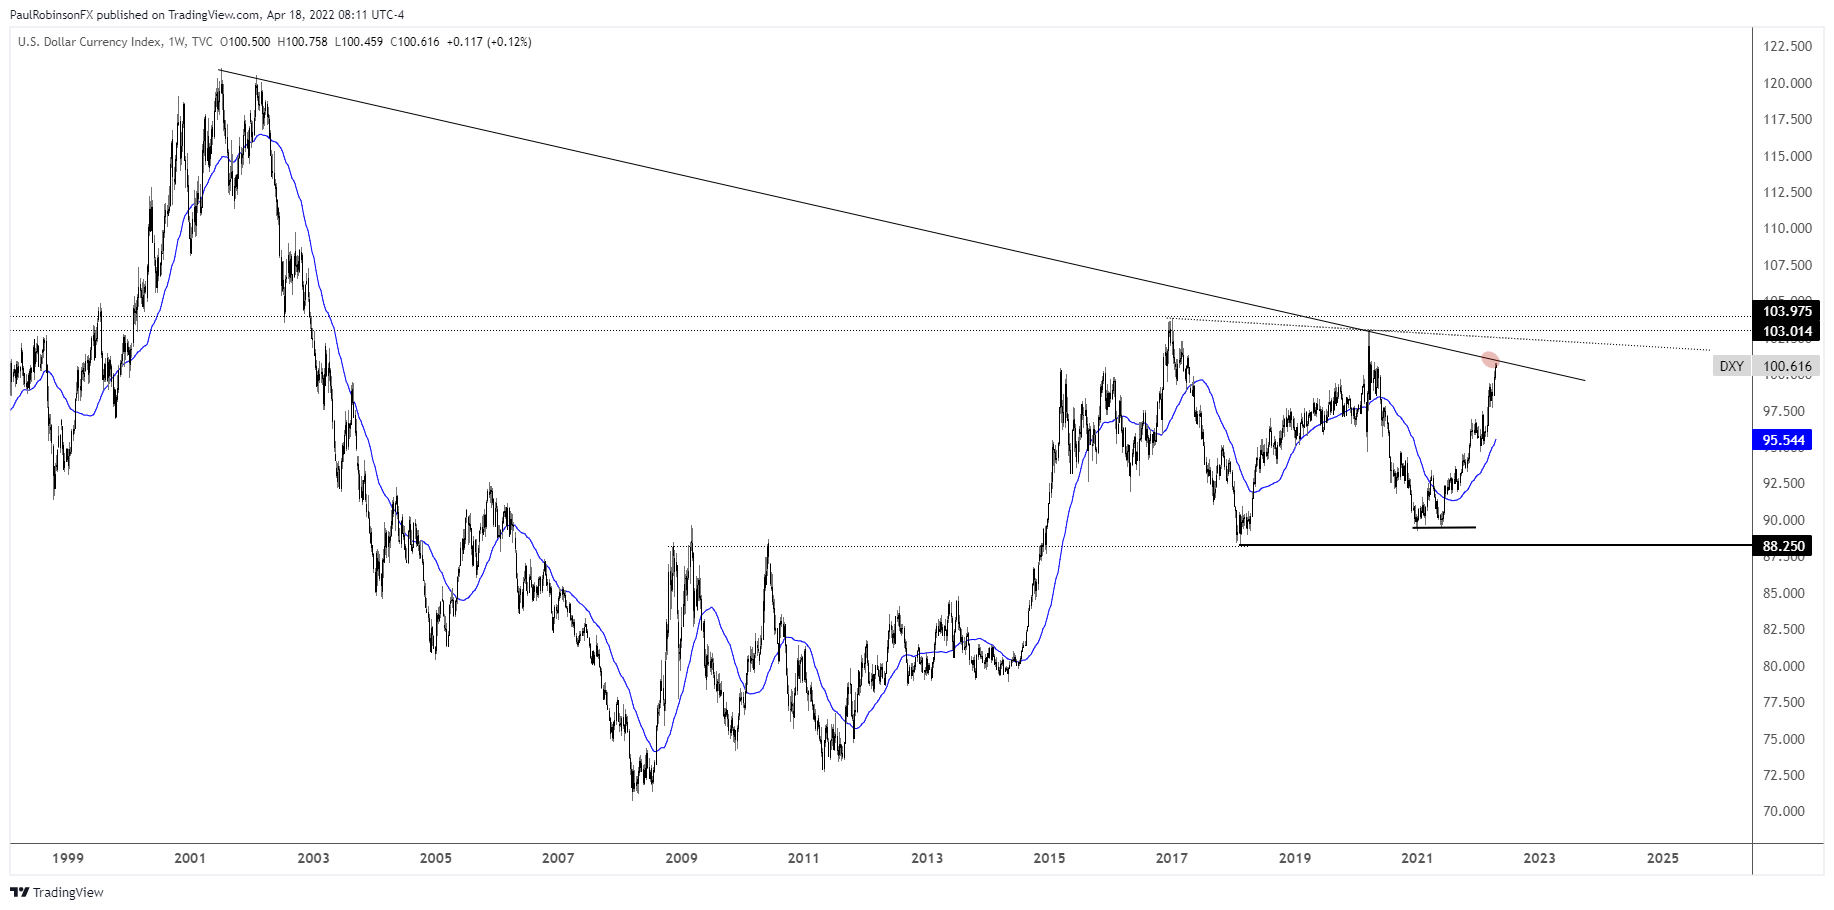
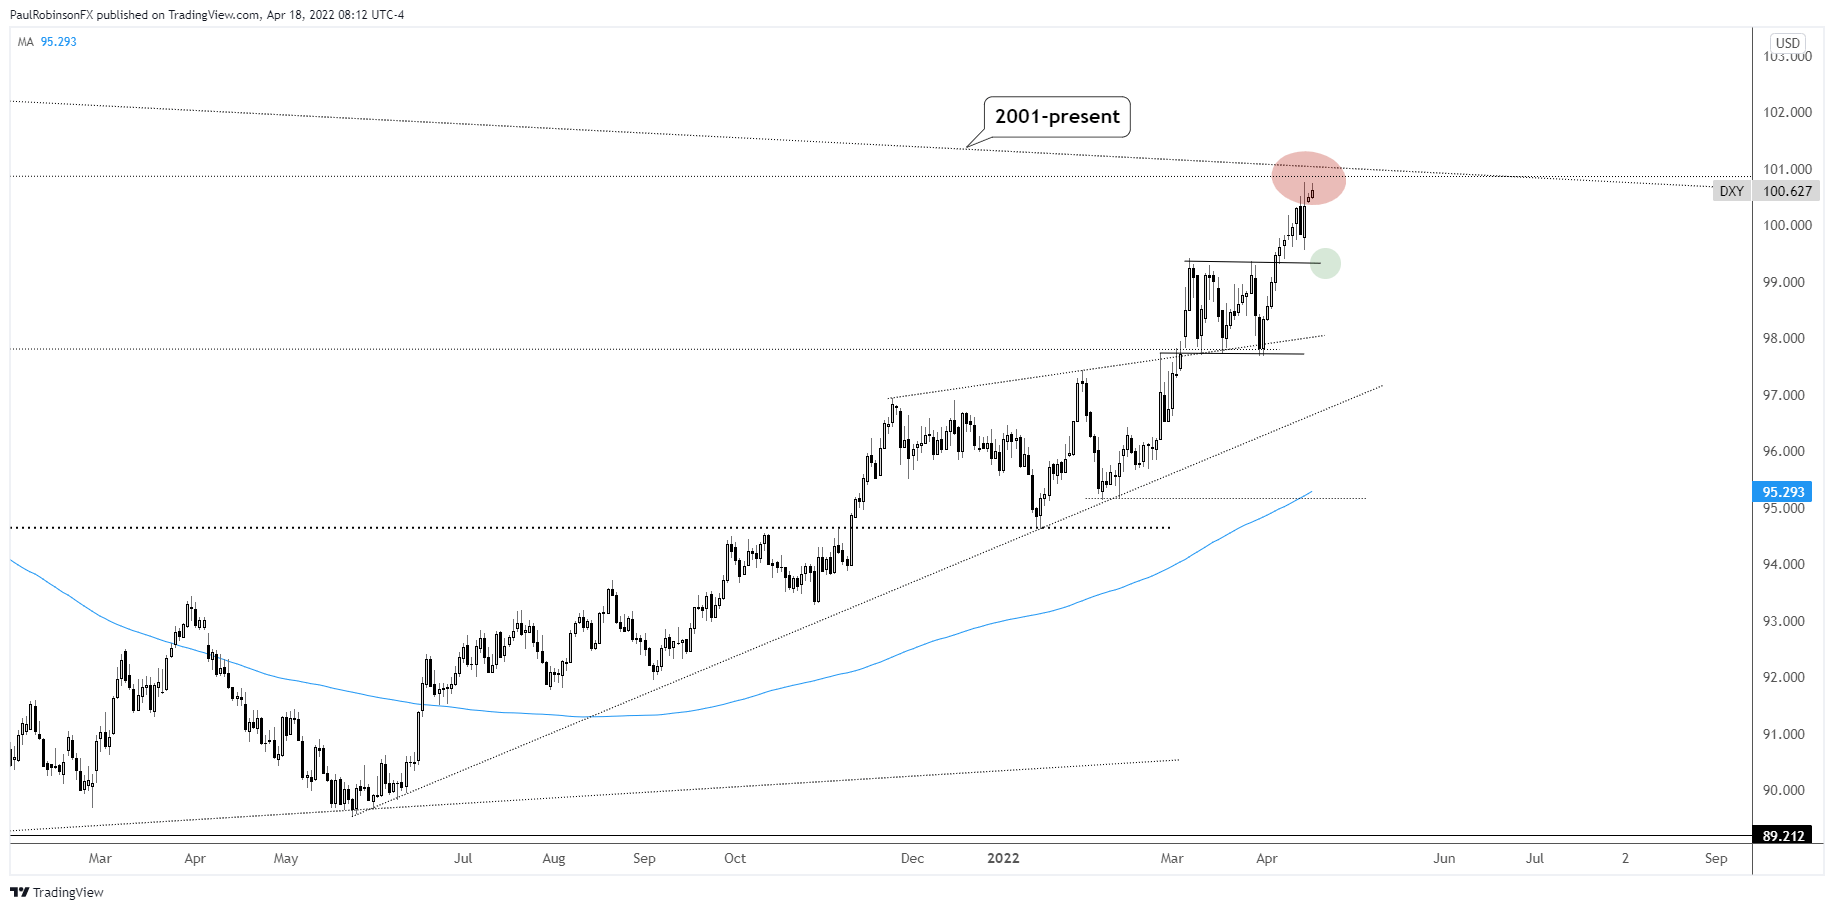
The US Dollar Index (DXY) is trading very near a trend-line dating to 2001. It only has the bare minimum connecting points to make it a trend-line, but the current rise towards testing the trend-line could become its first meaningful test and confirmation.
Given the duration of the trend-line a turn at any point from current levels (100.60) up to around 102 will be considered a test and validation of the trend-line. The buffer could extend higher if the DXY were to trade up and reverse hard on the monthly chart to close below the 100-102 area. The bottom line is that the DXY is in the warning zone for a reversal at a long-term threshold.
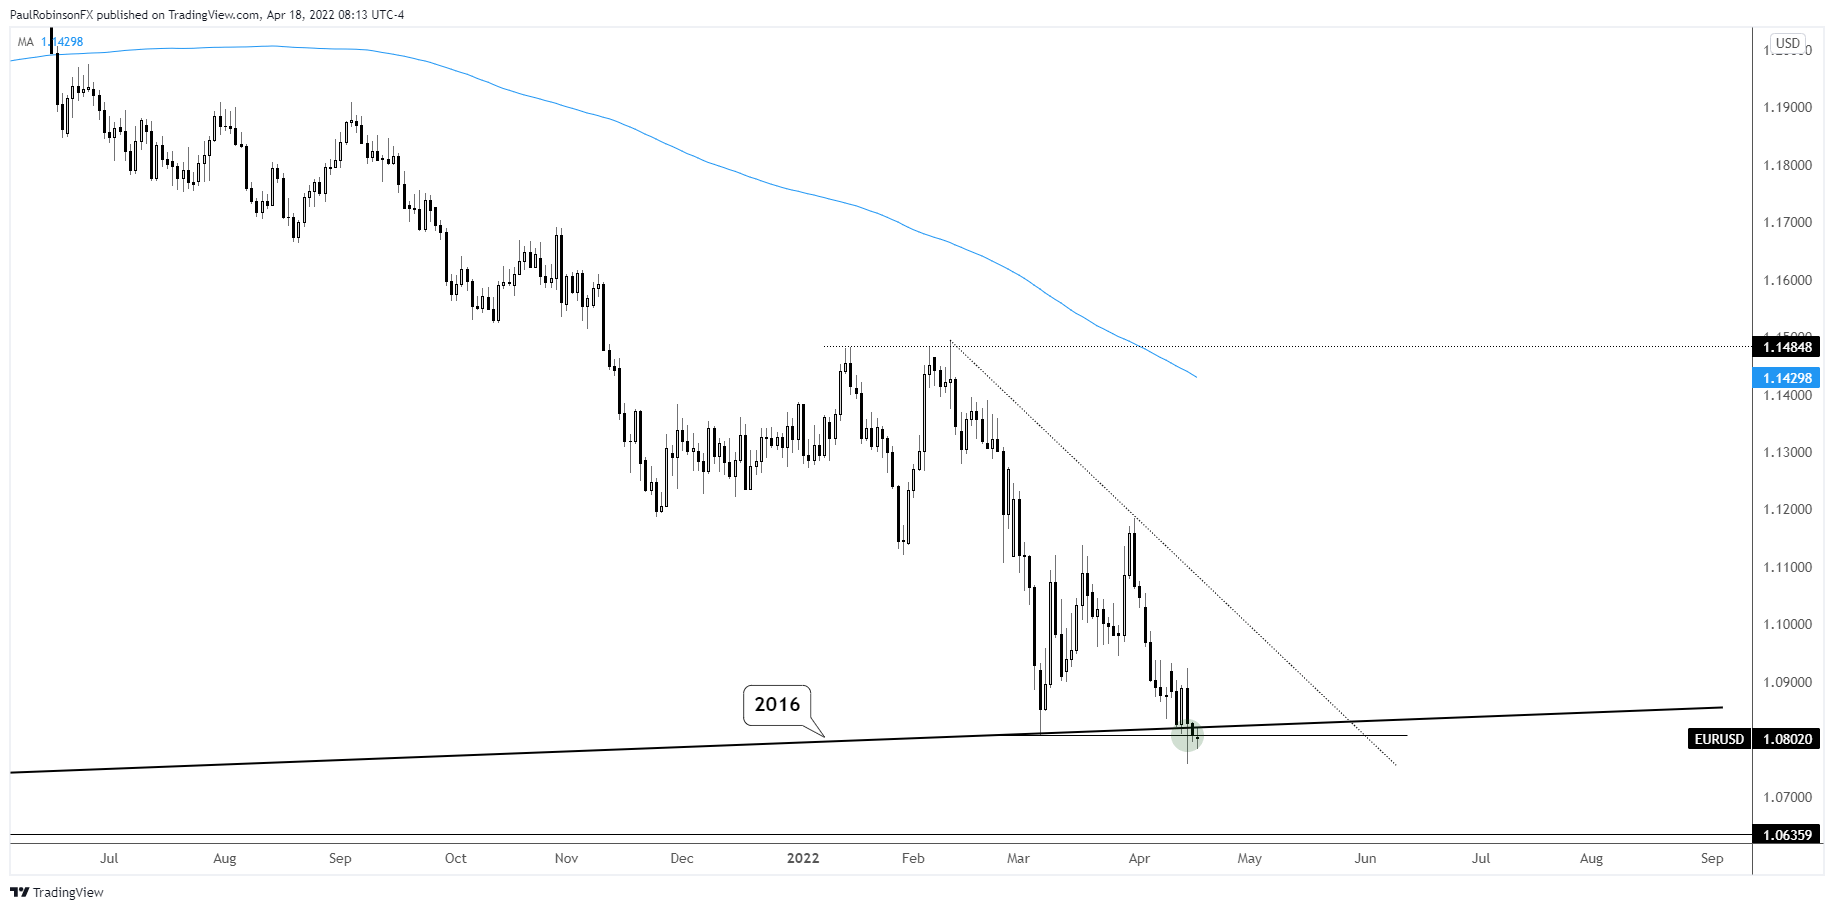
On Thursday, the Euro fell through the March 7 low (& 2016 trend-line) on a dovish ECB, but managed to close back above 10805 for the day and week (Thursday was effectively the last day of the week given the Good Friday holiday). The rejection to trade lower is seen as a potential catalyst this week for the Euro to bounce.
Given that the Euro makes up 57% of the DXY it of course has a significant impact on how the index moves. If the low from Thursday at 10757 holds then look for the Dollar Index to turn lower here in the days ahead.
The market is largely bearish the Euro, and it has been for good reason, but an overly bearish market that fails to break key levels with a catalyst is prone for a move back the other way. This could result in only a relatively small bounce, but the stage is set for a strong reaction.
A top-side reaction out of the Euro will at least dent the DXY to some degree, even if other currencies don’t follow suit in trading higher against the USD. The first level to watch on the downside is the top of the range it recently broke out of, it sits around the 99.41 level.
A hold of the top of the range will be important for the DXY if it to maintain a generally strong upward bias, as a decline into a range is effectively like falling into an air pocket and would be seen as leading to the other side of the range in the mid-97s.
If the DXY continues to press on higher in the days ahead, then look for trading to become more volatile as a queue that the trend is becoming unstable and may want to turn. Also, keep an eye on the March 2020 low at 10635 in EUR/USD as another major inflection point.
US Dollar Index (DXY) Weekly Chart
DXY Daily Chart
EUR/USD Daily Chart
Resources for Forex Traders
Whether you are a new or experienced trader, we have several resources available to help you; indicator for tracking trader sentiment, quarterly trading forecasts, analytical and educational webinars held daily, trading guides to help you improve trading performance, and one specifically for those who are new to forex.
—Written by Paul Robinson, Market Analyst
You can follow Paul on Twitter at @PaulRobinsonFX
Read More:Watch EUR/USD, Setback Could Be Near
2022-04-18 12:30:00