
WTI prices moved mostly sideways in the past week and ended the session somewhat negative. However, a very different story unfolds so far in the current week, where Oil prices remain positive after two consecutive upwards sessions on Tuesday and Wednesday. The move creates further interest in the Oil market and traders may find it challenging to list the headlines starting with the most important. This report will bring to light the key fundamentals currently driving Oil prices along with a brief technical analysis for WTI.
In the past days the weekly Oil market data somewhat failed to impress traders. Starting with the previous Friday, the Baker Hughes Oil rig count saw active Oil rigs in the US jumping from 533 to 546 with no major price reaction. On Tuesday the 12th of April the American Petroleum Institute indicated a big surplus of 7.76M barrels. This was API’s largest surplus so far in 2022 and despite the news being rather bearish for Oil prices, did not create the volatility expected leaving prices somewhat at par. A different story was observed upon release of the weekly Energy Information Administration’s (EIA) Crude Oil Inventories figure, which showed a huge surplus of 9.4M barrels. WTI dropped approximately $1.20 displaying a rather minor reaction despite the surplus being the largest under the EIA so far in 2022. The market’s limited reaction to the releases tends to imply traders are currently concerned with other more important subjects.
On a different note, the International Energy Agency (IEA) through its April report provided some interesting and important information. According to the report the impact of the Russian war in Ukraine remains a great source of uncertainty for the energy sector. Russian Oil supply which has already been decreased, is forecasted to drop even further looking forward due to the widening customer-driven embargo. European countries have already reduced their Russian Oil supply and may reduce it further in May, while Russian exports to China have been steady as mobility restriction and lockdowns seem to limit Oil demand. The only country that has been positive in terms of continuing and even uplifting trade relations with Russia is India. India has actively pursued Russian oil possibly taking advantage of Russia’s need for a significant Oil customer but also possibly to improved price bargains. Russian Oil exports to India are forecasted to have increased in 2022 and could continue to increase in the near future.
Furthermore, the OPEC April 2022 report was also released in the past days providing further insights and forecasts on the current fundamentals of the Oil market. According to the OPEC report, World Oil demand has increased so far in 2022 and is expected to increase further in the US and the biggest countries in Europe including the UK. Referring to China, it was noted that even though recent lockdowns seem to interfere, the largest Oil consuming country in the world is forecasted to maintain and possibly increase its Oil demand in the year ahead.
As a conclusion, Oil demand is expected to increase for the largest economies of the world backed by solid economic growth seen so far in the most developed economies. Yet as supply concerns connected to the war in Eastern Europe continue to loom, fears over an increase of the barrel price persist. Finally, Russia’s Oil trade with China could come under pressure in the following months as leader countries tighten their stance towards Russia.
Technical Analysis
WTI H4
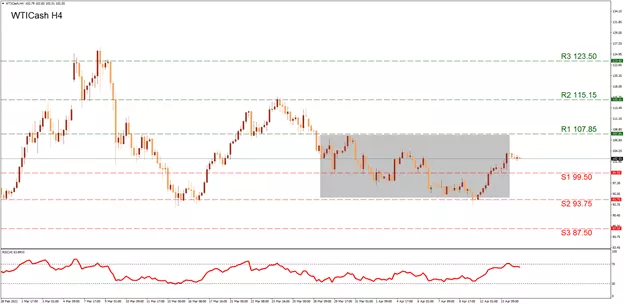
WTI is currently trading nearby $102.80 which is close to our (S1) 99.50 support level. Thus, in a downtrend scenario we consider the (S1) 99.50 support the most probable first test for the price action. If the downtrend is stronger, a move to the (S2) 93.75 barrier is also imminent. Please note the (S2) is the lowest level WTI has dropped to since mid-March and was tested for the last time on the 11th of April. A possible breach below the (S2) could confirm WTI is moving in a downtrend and may be heading to the (S3) 87.50 hurdle. In the opposite direction, a possible upward move could send the price action to the (R1) 107.85 resistance level which was last tested at the end of March and displayed solidity. Yet in an extreme bullish scenario we may see traders shifting their attention to the (R2) 115.15 line which is currently a monthly high price for WTI. If traders are looking for a more prolonged buying strategy we could also point to the (R3) 123.50 resistance which is the 2022 high price and was tested in March. The RSI Indicator below our chart has reached the 70 level in the most recent sessions yet has moved just below it, possibly signaling some stabilization for now. In our opinion, WTI continues to move in a sideways motion within the range highlighted with grey on our chart, between (R1) 107.85 resistance and the (S2) 93.75 barrier. This range has been used since the end of March and a breach outside this can signal a change in the current trend.
Read More:Oil Outlook: Is $100 per Barrel Becoming the New Average for WTI?
2022-04-15 04:46:31