
Global indices experienced serious volatility through Q1 2022, disrupting otherwise-extraordinary bullish – or generally buoyant – trends. In the former camp, the S&P 500 was carving out an extraordinarly tight and persistent rising trend channel up until the start of the year. The pullback we experienced these past three weeks was not consistent and didn’t register as a full-blown ‘collapse’, but it has broken the complacent bid which has been a feature of the market since the recovery from the 2007-2008 financial crisis. The close of March pushed us into the middle of 2022’s range thus far. Stall and reverse before we get to 4,820 and we are looking at a head-and-shoulder pattern. We may well consolidate for a time, but 4,820 and 4,100 are the critical levels.
S&P 500 Weekly Chart
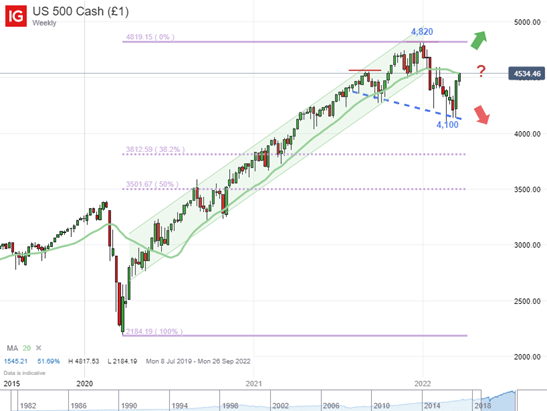
Chart created with the IG Platform
DAX 40
The benchmark German index experienced much the same technical backdrop as its US counterpart in the post-pandemic recovery, but the period between April 2021 and February of this year was more overtly a pattern of consolidation rather than just a slower advance. In structure, that 10-month period takes the shape of a head-and-shoulders pattern with the break of 14,850 charged by Russia’s invasion of Ukraine confirming the ‘neckline’. The technical plunge that resulted in that clearance was extraordinary, pushing the 14-week RSI to an oversold measure that rivalled the pandemic shutdown collapse in February and March of 2020. Starting off the new quarter, we are retesting former support at 14,850 as new resistance. Break above that and the market will likely prove very choppy for the next three months. Hold and retreat, on the other hand, and it will look like a textbook progressive reversal.
DAX 40 Weekly Chart

Chart created with the IG Platform
FTSE 100
Where the DAX 40 broke its extended support and now faces a decision of whether to treat the level as new resistance, its UK neighbor experienced the Ukrainian invasion volatility without breaking the critical technical floor. After suffering its worst week since the height of the pandemic in late February, the index plunged to a frequented zone of support between 6,800 – 6,900. The index tested the floor, but ultimately held. That leaves us with some fairly clear technical boundaries to work with moving into the new quarter. Beyond the 6,850 immediate floor, the next levels down are the 38.2 and 50 percent retracements of the post-pandemic run at 6,575 and 6,230 respectively. To the upside, the approximate 7,700 swing high from February happens to extend a range resistance back to August 2018. Resistance is really a zone, however, all the way up to the record high of 7,900 set in early 2018.
FTSE 100 Weekly Chart

Chart created with the IG Platform
HANG SENG INDEX
Of the major global indices, perhaps the widest divergence from the mean comes from the Chinese and Hong Kong markets. The structure of the Hang Seng Index is materially different than what we see in the S&P 500 or the DAX. With a series of lower major highs over the psat four years – in part due to the progression of the trade wars and Covid policies – the first quarter volatility hit when the market was positioned near support. Clearing the range low at 22,850 spun up enough momentum to subsequently break trendline support stretching back to 2009 and the midpoint of the post-Great Financial Crisis range. That support now stands as immediate resistance heading into Q2. A break higher wouldn’t likely be clean given the density overhead. Alternatively, a hold and rejection from that 22,000 mark can shift the market’s course to a wide range established through last quarter’s volatility down to 18,000 which is a range low established in three big tests stretching back over the past decade.
HSI Weekly Chart
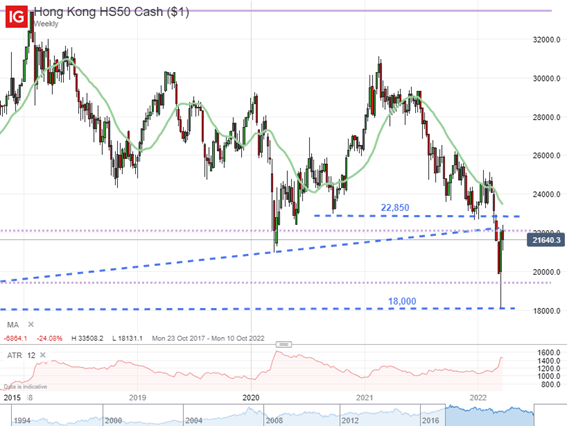
Chart created with the IG Platform
Read More:Indices Have a Serious Choice to Make After Q1 Volatility
2022-04-02 22:30:00