
Gold Technical Price Forecast: XAU/USD Weekly Trade Levels
Gold prices are attempting to mark a sixth-consecutive weekly advance with a breakout in XAU/USD surging more than 12.4% off the yearly low. As Russia’s war in Ukraine rages on, haven flows have continued to favor gold with the rally now eyeing key resistance objectives near the record highs. These are the updated targets and invalidation levels that matter on the weekly technical chart. Review my latest Weekly Strategy Webinarfor an in-depth breakdown of thisgold technical setup and more.
Gold Price Chart – XAU/USD Weekly
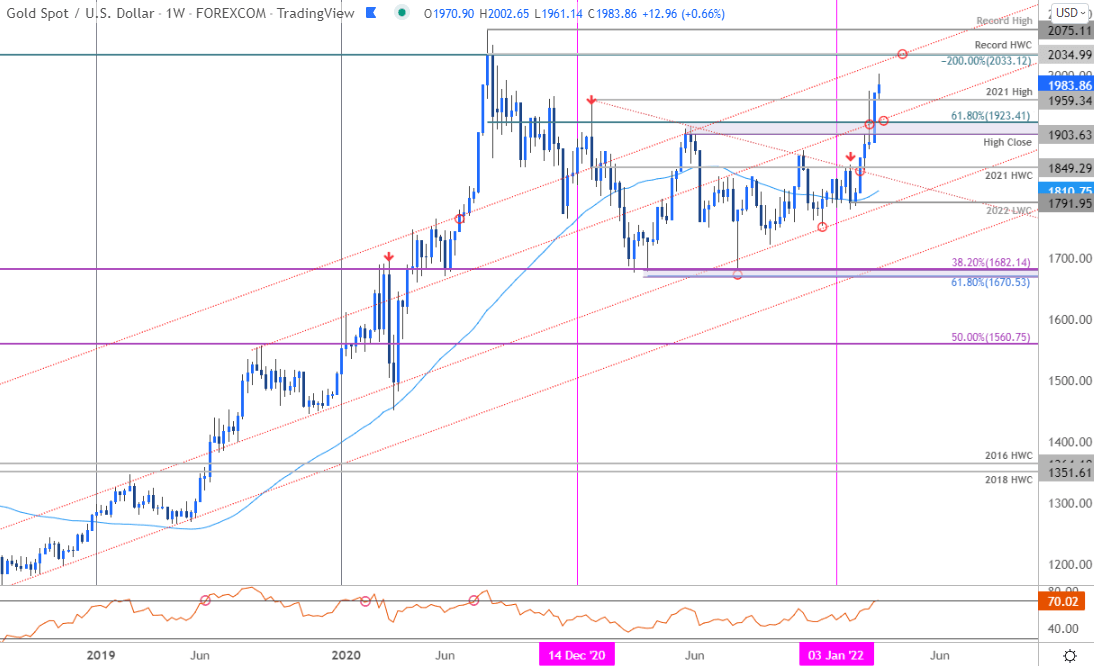
Chart Prepared by Michael Boutros, Technical Strategist; Gold on Tradingview
Notes: In my last Gold Weekly PriceOutlook we noted that the XAU/USD testing a key resistance zone and that, “A topside breach / close above 1923 is needed to mark resumption with such a scenario exposing subsequent resistance objective at 2021 swing high again at 1959 and the record high-week close at 2034.” Gold ripped higher the following week with price registering a weekly close above the 1959 target last week. The focus remains on the next major resistance objective at 2034– a breach / weekly close above this threshold is needed to challenge the record high at 2075.
Initial weekly support now rests back 1959 backed by the 2021 high close / 61.8% Fibonacci retracement of the 2020 decline at 1903/23– intra-week losses should be limited to this threshold IF price is heading higher on this stretch.
Bottom line: The gold breakout has cleared key resistance targets and keeps the broader focus higher in XAU/USD. From a trading standpoint, the outlook remains tilted to the topside while above 1903- look to reduce long-exposure / raise protective stops on a stretch towards 2034. Review my latest Gold Price Outlook for a closer look at the near-term XAU/USD technical trade levels.
For a complete breakdown of Michael’s trading strategy, review his Foundations of Technical Analysis series on Building a Trading Strategy
Gold Trader Sentiment – XAU/USD Price Chart
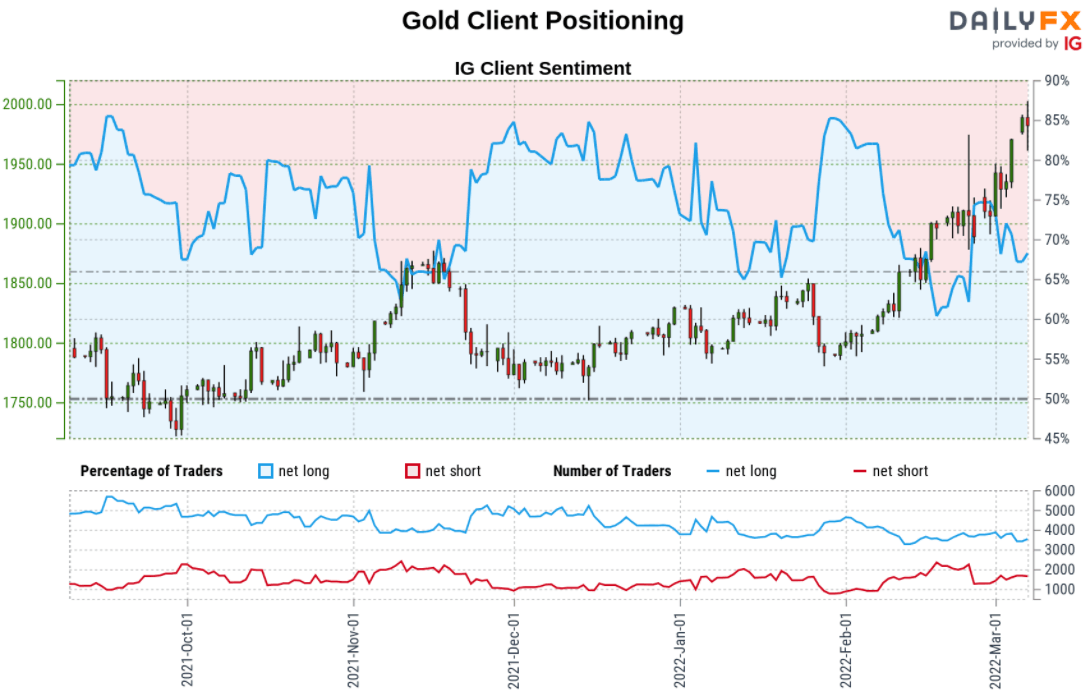
- A summary of IG Client Sentiment shows traders are net-long Gold- the ratio stands at +2.28 (69.51% of traders are long) – typically bearishreading
- Long positions are5.83% higher than yesterday and 10.34% lower from last week
- Short positions are 5.03% lower than yesterday and 10.07% higher from last week
- We typically take a contrarian view to crowd sentiment, and the fact traders are net-long suggests Gold prices may continue to fall. Trader are more net-long than yesterday but less net-long from last week. The combination of current positioning and recent changes gives us a further mixed Gold trading bias from a sentiment standpoint.
—
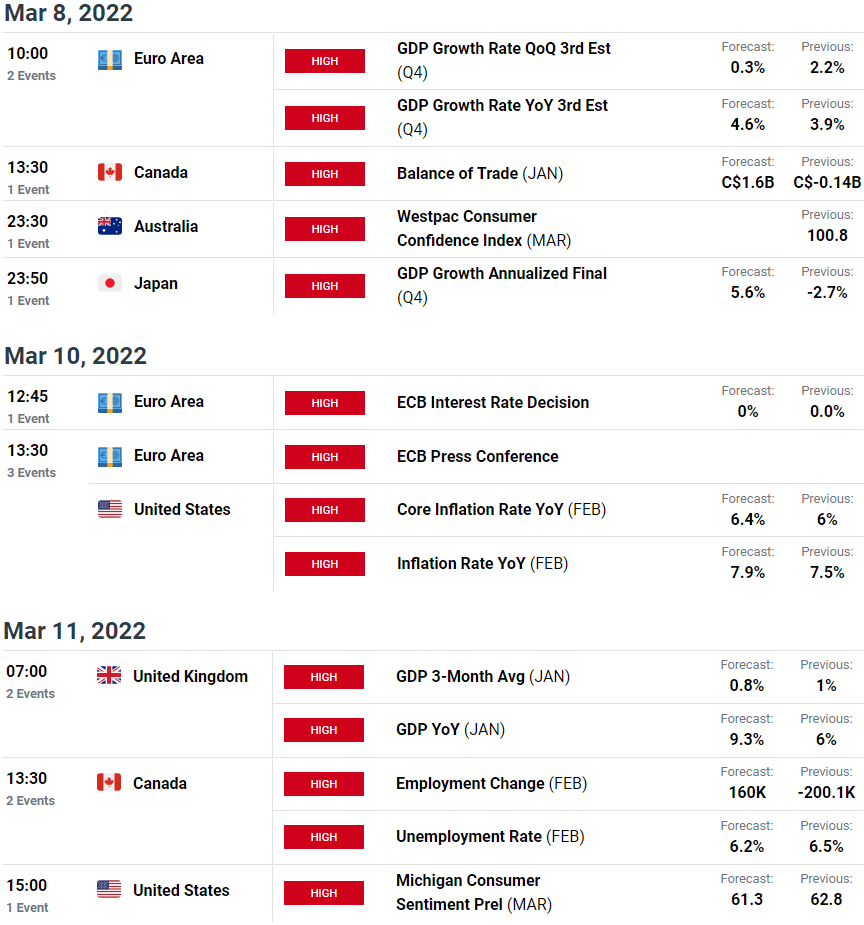
Economic Calendar
Previous Weekly Technical Charts
– Written by Michael Boutros, Technical Strategist with DailyFX
Follow Michael on Twitter @MBForex
Read More:Gold Breakout Hits 2K as War Tensions Drive
2022-03-07 20:00:00