
Gold Technical Forecast: Bullish
- It was a big week for Gold with prices jumping higher after an early-week support test at the 1900 level.
- As looked at a couple of weeks ago, the war bid has taken over here and it doesn’t look as though we’re any closer to resolution on the Russia-Ukraine scenario, keeping the door open for further gains and a push back above the $2,000 psychological level.
- The analysis contained in article relies on price action and chart formations. To learn more about price action or chart patterns, check out our DailyFX Education section.
It was a big week for Gold prices and somewhat of the mirror image of the prior week. In the prior week, a strong bid developed as the yellow metal pushed up to a high of 1976.5. But sellers pounced to push Gold back below the psychological 1900 level ahead of the weekend.
But, when this week’s open prices began to trickle in Gold gapped back above 1900, and after some strong give-and-take price action in the early portion of the week buyers made a forward push. The big driver in the latter portion of the week was the attack on the nuclear power plant in Ukraine. This shows evidence that Russia doesn’t look to be vying for negotiating power and it also makes a resolution of the situation seem that much more distant, thereby placing even more geopolitical risk on top of the situation.
As I had looked at a couple weeks ago, the war bid has taken over in Gold and this week was further evidence that it might not yet be ready to leave the market. This can keep the focus on the long side of Gold until something shifts, and the $2,000 psychological level is now very nearby and this becomes a possible objective for next week’s trade, as inflation comes back into the spotlight on the Thursday release of CPI information out of the United States.
Gold Monthly Price Chart
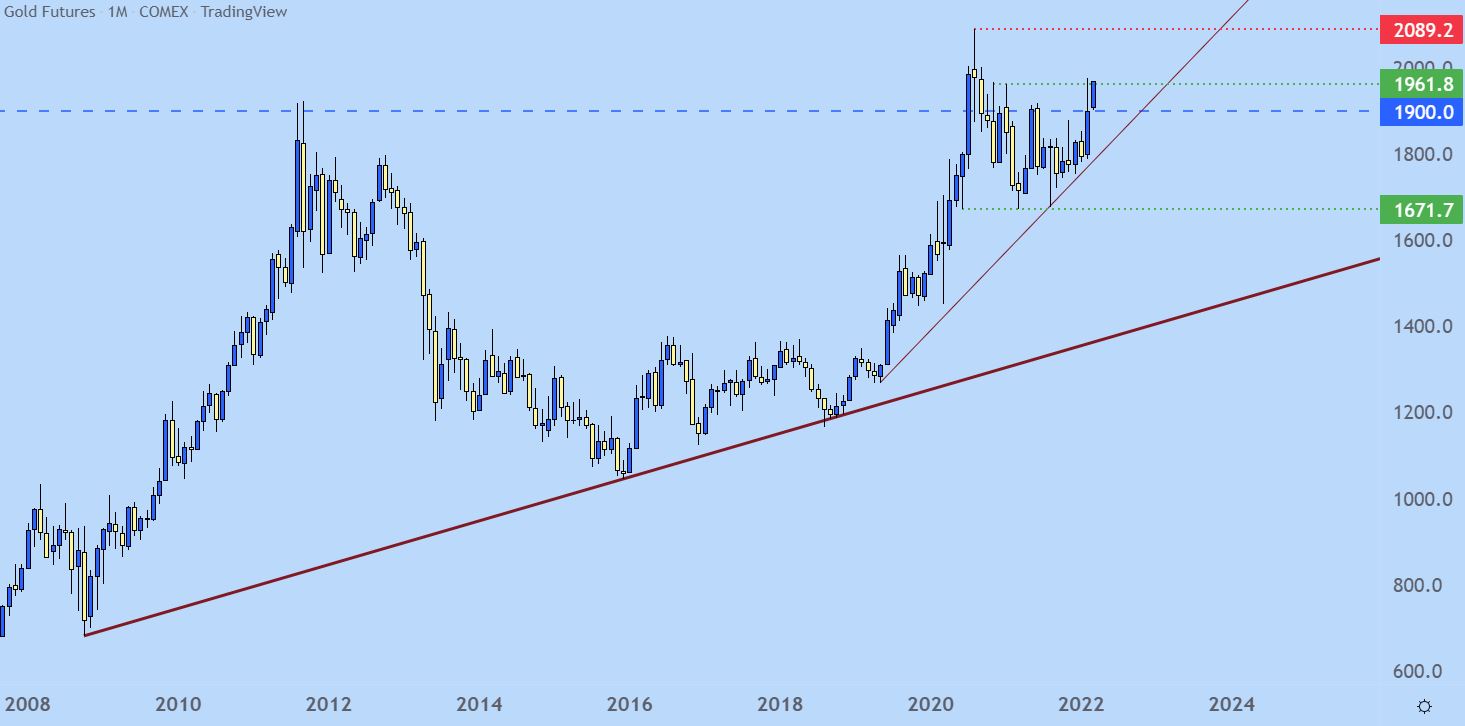
Chart prepared by James Stanley; Gold on Tradingview
Gold Shorter-Term
As already noted the early portion of this week was very messy in Gold, on the heels of last week’s massive reversal move. But Wednesday and Thursday saw a topside trend start to developed that helped Gold bulls to get a greater handle on the situation, leading to a strong push back up to the 1976.5 high that showed up in the prior week.
This keeps the door open for continued breakout potential as the continuation of higher-lows that’s shown of recent has put bulls in a prime spot to re-test that prior swing high.
Just above that level, however is a significant area of psychological resistance at the 2k marker, and that could possibly buffer the bullish move, although when it came into play in the summer of 2020 there was very little slowdown in the breakout as Gold prices pushed right up to the current all-time-high of 2089.
For short-term support, prior resistance at 1952 remains of interest. And there’s a shorter-term level, as well, at 1961.8, which was the high in 2011 and functioned as the all-time-high for almost a full nine years until the 2020 breakout.
Gold Hourly Price Chart

Chart prepared by James Stanley; Gold on Tradingview
— Written by James Stanley, Senior Strategist for DailyFX.com
Contact and follow James on Twitter: @JStanleyFX
Read More:Gold Goes for 2k as the War Bid Drives XAU/USD
2022-03-04 20:00:00