
Nasdaq 100 index Technical Forecast: Bearish
- The Nasdaq 100 index hit an all-time high of 13,879 before entering into a technical correction
- Prices broke the “Ascending Channel” and formed a lower high, suggesting that near-term downward pressure is prevailing
- The 20-day SMA line crossed below the 50-day and 100-day SMA lines, potentially leading to the formation of a “Death Cross”
The Nasdaq 100 index reached its all-time high of 13,879 on February 16th before entering a consolidative period. Prices broke below the “Ascending Channel” and reversed sharply lower, pulling the 20-day SMA below the 50- and 100-day lines. This points to the potential formation of “Death Cross”, which usually signals a major trend reversal. The last time the 20-day crossed below the 100-day SMA line was back to March 2020, when the index tumbled more than 30% during the pandemic-induced selloff.
Last week, the Nasdaq 100 index failed to breach above the trend-defining 50-day SMA line and has reversed lower, suggesting that a deeper pullback is possible because it appears to be forming a “lower high” on the daily chart.
An immediate support level can be found at 12,600 – the 76.4% Fibonacci extension. Breaking below this level would likely intensify selling pressure and thus open the door for further losses with an eye on 12,390, the 61.8% Fibonacci extension level.
An attempt to stand above 12,950- where the 100% Fibonacci extension and the 100-day SMA line intercept – will likely encourage bulls to take over control and carve a path for price to challenge an immediate resistance level of 13,343 – the 127.2% Fibonacci extension.
Nasdaq 100 Index – Daily Chart
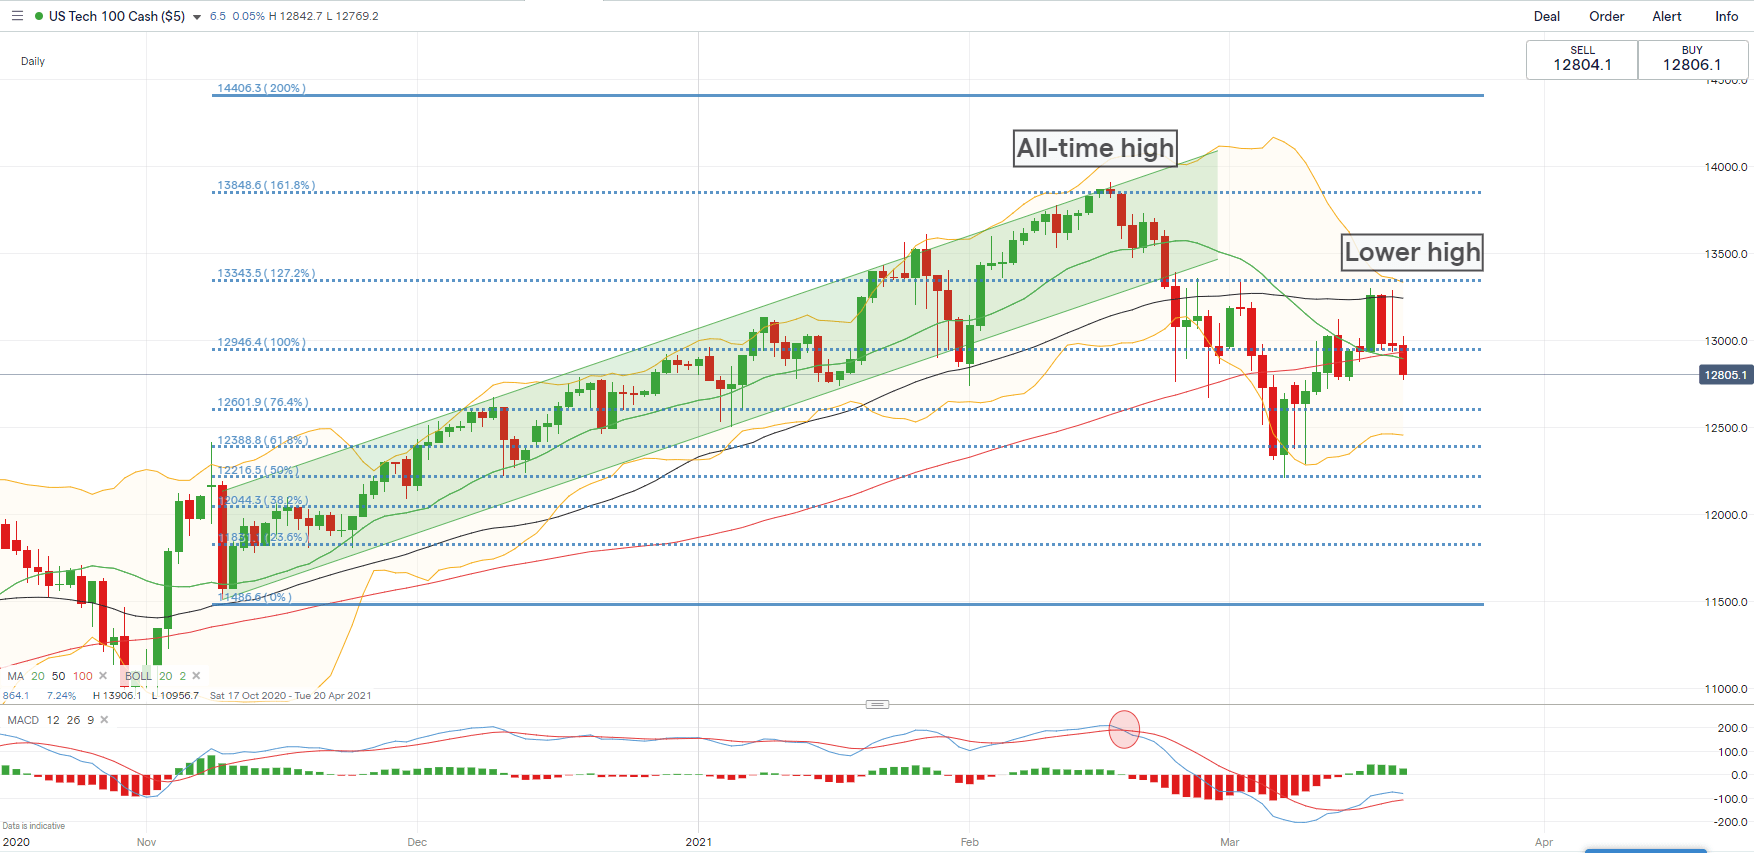
Chart by IG
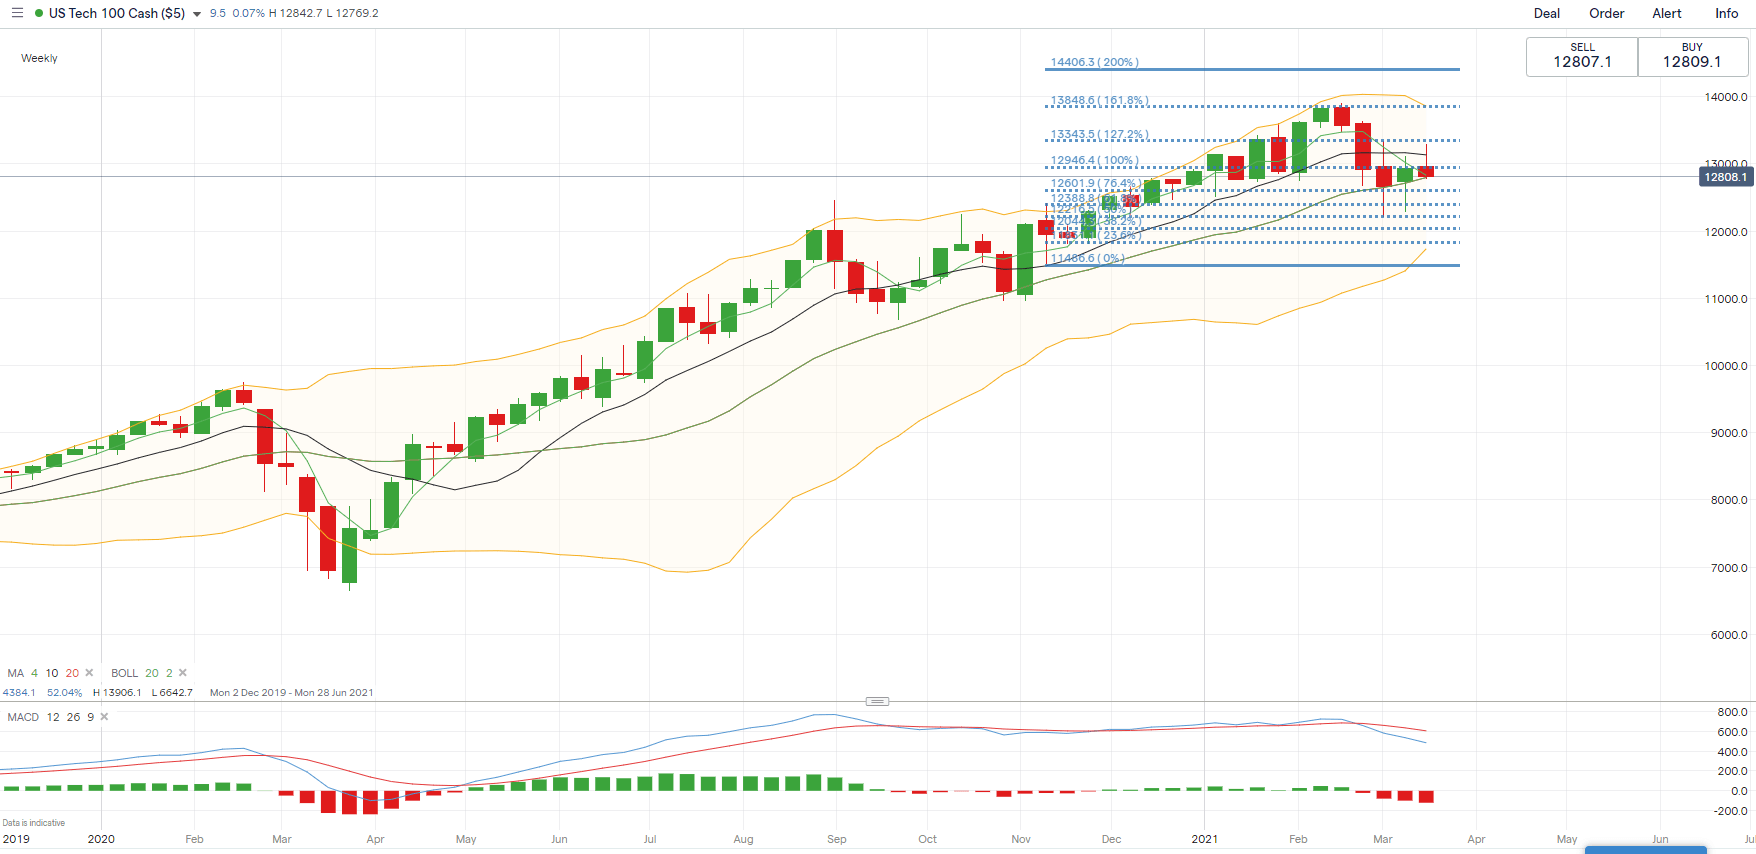
On the weekly basis, the Nasdaq 100 index pocketed an astonishing gain of 107% from late March 2020 until early February 2021(chart below). The near-term trend has likely turned bearish as the 4-period SMA crossed below the 10- and 20-period SMA lines. Prices struggled to remain above the trend-defining 20-period line, breaking which signals the entering into the lower Bollinger Band. The MACD indicator formed a bearish crossover in later February and trended lower since, suggesting that upward momentum is fading.
Nasdaq 100 Index – Weekly Chart

Recommended by Margaret Yang, CFA
Don’t give into despair, make a game plan
— Written by Margaret Yang, Strategist for DailyFX.com
To contact Margaret, use the Comments section below or @margaretyjy on Twitter