
Nasdaq 100, EURUSD, USDJPY, Dogecoin and USDCNH Talking Points:
- With a strong NFP reading to end this past week, US indices earned a life-breathing bounce that may have curbed an all-out selloff
- Nevertheless, the Nasdaq 100 registered a clear head-and-shoulders breakdown leading a higher probability shift for the most charged ‘risk’ measures
- Meanwhile, EURUSD may very transition seamlessly from yield differential to NFP-led growth disparity to ECB-CPI event skew

Recommended by John Kicklighter
Read the DailyFX Analysts’ favorite trades of 2021!
How Much Does a Bounce Thwart Reversal Fears?
Markets don’t travel in straight lines. Sentiment is generally a push and pull on sentiment that leads to corrections that can obscure broader trends. With that said, is the prevailing course for the S&P 500, Nasdaq 100 and other risk-leading benchmarks bullish or bearish? If I were to base that evaluation over the past decade, it would be fair to suggest the current is firmly bullish. Even if the period of evaluation was just the past year, the post-pandemic recovery is still generally the guiding wind. Yet, honing in on more recent time frames, the situation is more ambiguous. From the S&P 500, there was a prominent breakdown of the steadfast bull trend from the March 23rd, 2020 swing low at 3,800; but an NFP-supported Friday bounce seemed to offer a technical lifeline. Meanwhile, the Nasdaq 100’s own rebound wouldn’t yet pull the market back above the breaking point of the head-and-shoulders pattern. Further, one of the heaviest bouts of volume from the popular QQQ ETF in the past decade (a two-week daily average of 86.2 million shares for the third highest average), suggests markets are registering the risk of potentially seismic course correction.
Chart of QQQ Nasdaq 100 ETF with 100-Day Mov Avg and Volume (Daily)
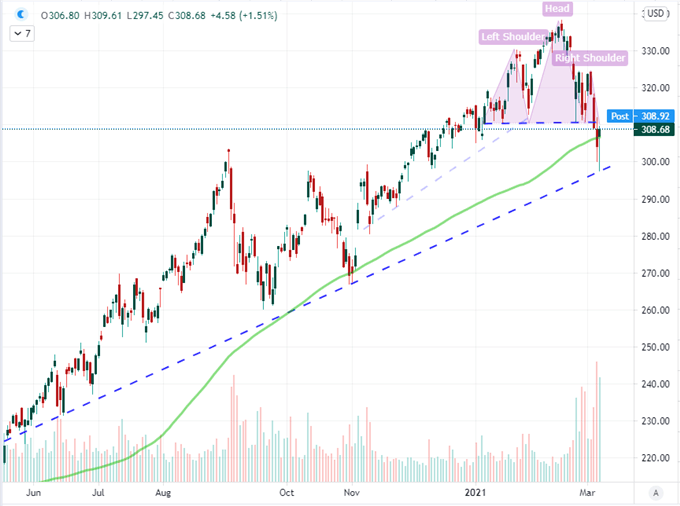
Chart Created on Tradingview Platform
When it comes to monitoring the intent of the entire financial system, it can be difficult to register a trend change when monitoring the frequently gradual shifts that can unfold. Full unwinding of blue chip measures like the Dow Jones Industrial Average dipping into a technical bear market (20 percent correction from highs) much less a systemic deleveraging of exposure across many ‘risk assets’ general takes significant time. However, at the extremes of the speculative curve, we can more readily gauge temperature changes – though these readings can often prove premature. Given most measures of speculative sentiment that I track don’t even qualify for technical ‘corrections’ (10 percent retreat from highs), I think it is far too early to call the situation. However, the sheer excesses across the system dramatically skew the risks in remaining complacent. We have seen the rise and fall of influence from the social trends (like the WallStreetBets Reddit board) lead general speculative interests. Notably, global Google search interest in ‘day trading’ and ‘penny stocks’ eased markedly this past week. Though, high finance has yet to conform to that threat of peaking with interest in SPACs (fast tracked alternatives to IPOs) notching fresh highs.
Chart of Global Google Search for ‘Day Trading’, ‘Penny Stock’ and ‘SPAC’ (Weekly)
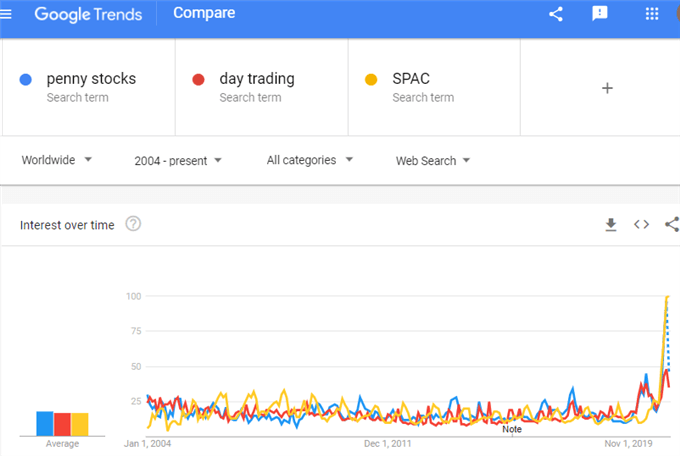
Chart Created by John Kicklighter with Data from Google Trends
Yields Still the Top Fundamental Driver for Risk Trends and the Dollar
As we look to find our way forward as an entire market, the most compelling drive is likely to be found through common fundamental banners. There is potential that themes like long-awaited approval of US stimulus or general enthusiasm around the progress of global vaccinations could win over a vague sense of enthusiasm; but as of right now, fear around rising yields seems to have already captured our collective attention. Instead of feeding expectations for higher rates of return in the near future, this climb is being interpreted as the market’s concern that central banks will be forced to withdrawal the safety net that has fueled years of speculative excess. While Friday’s bounce did ease the climb in the US 10-year Treasury’s yield, it is still driving high with a fifth consecutive week’s climb for the longest unbroken advance in three years. What’s more, this is not a trend isolated to the United States as yields across the world are swelling.
Chart of US 10-Year Yield with Agg 10-Yr Yield Gov’t Bond Yield and Consecutive Weeks (Weekly)
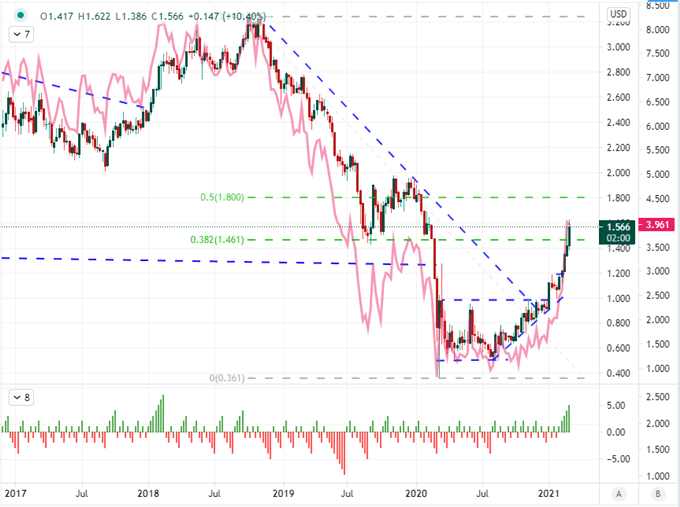
Chart Created on Tradingview Platform
As I watch the market with an eye towards yields and their connection to risk trends, there are a number of fundamental events that can prove significantly more potent than they may otherwise seem. Given the particular attention paid to US rates, it is important to monitor ‘regular’ event risk like the weekly Treasury auctions. However, the top listing on my docket would be the Wednesday consumer price index (CPI) update for February. If inflation starts to climb faster than the central bank anticipates, it will fuel fears that the Federal Reserve will be forced to hike far earlier than they have projected in their guidance – ushering in that safety net withdrawal.
Chart of US CPI Year-Over-Year and 5-Year Breakeven Inflation Rate (Monthly)
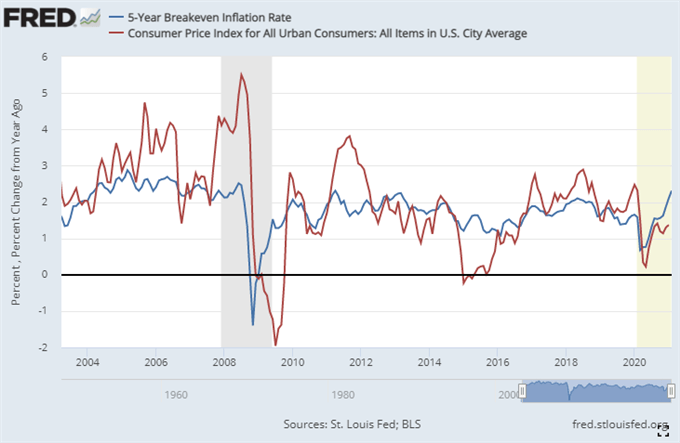
Chart from the St Louis Federal Reserve Economic Database
EURUSD, USDJPY and USDCNHIn Different Stages of Full Reversal
Overall, the Dollar seems to mirror the staging of the potential of a risk reversal for measures like global indices. This could represent the currency taking back up its role as a safe haven, but here are additional fundamental aspects at play which could further build its potency for turning tide. This past Friday’s nonfarm payrolls (NFPs) beat for example can cater to the relative appeal of economic recovery in the United States. In this vein, EURUSD’s slide through 1.1950 can present technical comprehension of a fundamental upheaval. On the other side of the pair, it will be important to monitor the European Central Bank (ECB) rate decision scheduled for Thursday.
Chart of EURUSD with 50 and 100-Day Moving Averages (Daily)
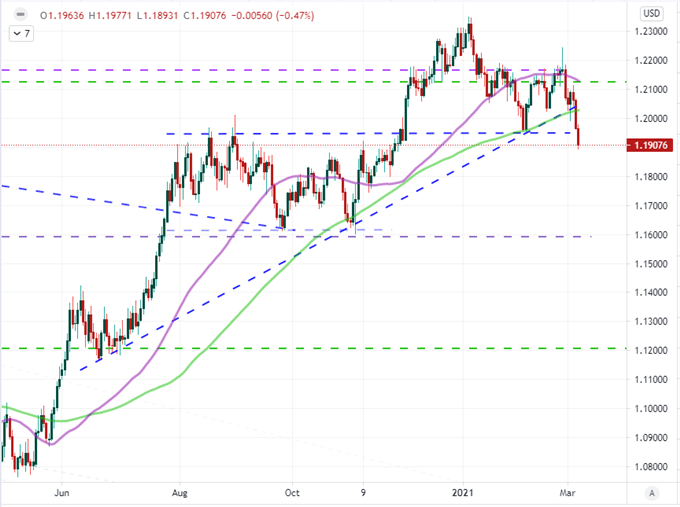
Chart Created on Tradingview Platform
A Dollar move that has is more engrained and technically impressive is USDJPY’s climb. The pair has swung nearly 600 points higher from the low set at the beginning of the year and the three week rally through this Friday’s close in particular is the fastest rate of climb over that period since September 2017 (last March’s post-pandemic rally was more abrupt). This pair holds serious connotations as a risk appetite measure from the past, but the sensitivity of all yen crosses to this fundamental theme has slackened substantially. On the other hand, the rise in yields seems to have a strong correlation to performance as of late.
| Change in | Longs | Shorts | OI |
| Daily | -9% | 2% | -3% |
| Weekly | -16% | 43% | 11% |
Chart of USDJPY with 50 and 100-Day Moving Averages (Daily)
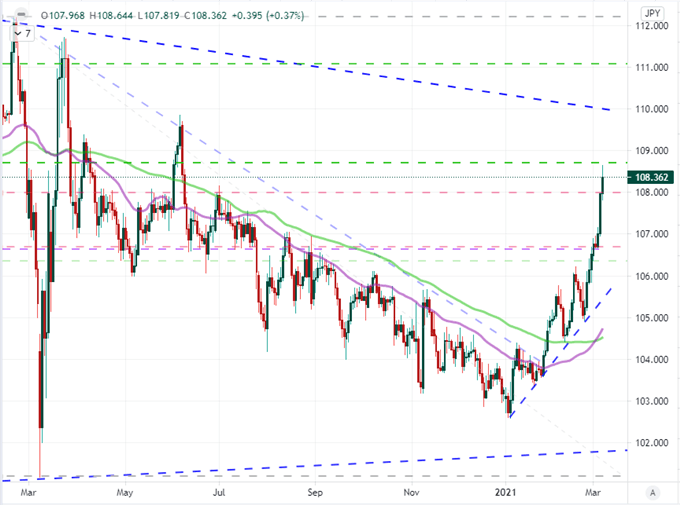
Chart Created on Tradingview Platform
Finally, a Dollar pair that has flown under the radar given the more dramatic technical milestones amongst the majors is USDCNH. The Greenback’s pairing to the Chinese Yuan represents significant fundamental and notional considerations, but many simply overlook it as a contrived reflection of trade relation perceptions between the two largest economies in the world. While I don’t consider this pair to be the most indicative of open market trends, those lines of influence are nevertheless extraordinarily important to the market’s global landscape. On Friday, this pair closed above 6.5000 for the first time this year. With trade talks ongoing between Beijing and a new administration in Washington as well as the ongoing National People’s Congress expected to generate further headlines, this is a pair that can represent its own opportunities and/or act as a general barometer.
Chart of USDCNH with 50 and 100-Day Average (Daily)
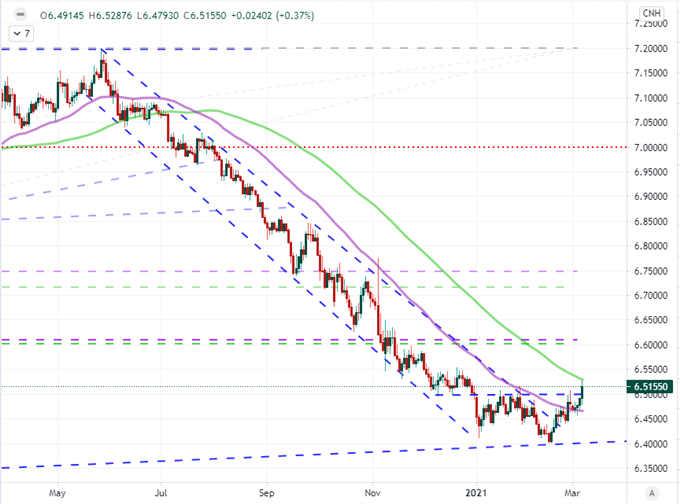
Chart Created on Tradingview Platform

Recommended by John Kicklighter
Building Confidence in Trading
.
Read More:EURUSD and Nasdaq 100 to Start Week with Multi-Month Breakdown
2021-03-06 08:15:00