
TSX-V: MKO; OTCQX: MAKOF
VANCOUVER, BC, Nov. 30, 2022 /PRNewswire/ – Mako Mining Corp. (TSXV: MKO) (OTCQX: MAKOF) (“Mako” or the “Company“) is pleased to provide financial results for the three months ended September 30, 2022 (“Q3 2022“), which is the fifth full quarter of financial results since declaring commercial production on July 1, 2021 at its San Albino gold mine (“San Albino“) in northern Nicaragua. For detailed Q3 2022 operating results, please see the press release dated October 21st, 2022 (“Operating Update”). All dollar amounts referred to herein are expressed in United States dollars unless otherwise stated.
Q3 2022 Highlights
Financial
-
$13.6 million in Revenue
-
$4.0 million in Adjusted EBITDA(1)
-
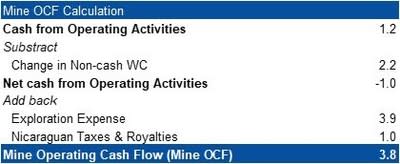
$3.8 million in Mine Operating Cash Flow (“Mine OCF“) (1) (3)
-
$7.0 million in Net Loss after $5.4 million of depreciation, depletion(4) and amortization and $3.9 million in exploration expenses
-
$1,018 Cash Costs ($/oz sold) (1) (2)
-
$1,102 Total Cash Costs ($/oz sold) (1) (2)
-
$1,367 All-In Sustaining Costs (“AISC“) ($/oz sold) (1) (2)
-
Three monthly repayment installments totaling $1.1 million were made on the Sailfish Loan during Q3 2022
|
(1) |
Refers to a Non-GAAP financial measure within the meaning of National Instrument 52-112 – Non-GAAP and Other Financial Measures Disclosure (“NI 52-112“). Refer to information under the heading “Non-GAAP Measures” as well as the reconciliations later in this press release. |
|
(2) |
Refers to a Non-GAAP ratio within the meaning of NI-52-112. Refer to information under the heading “Non-GAAP Measures” later in this press release. |
|
(3) |
Refer to “Chart 1 – Q3 2022 – Mine OCF Calculation and Cash Reconciliation (in $ millions)” for a reconciliation of the beginning and ending cash position of the Company, including OCF. |
|
(4) |
Refer to Corporate Update: Depreciation and Depletion (Page 4) for more detailed information |
Growth
Subsequent to September 30, 2022
Akiba Leisman, Chief Executive Officer, states that “Q3 2022 was the fifth full quarter of financial results since declaring commercial production at San Albino. The decline in recoveries from March through August of 2022 (77.0% vs. 86% expected in Q3) and lower throughput (as we optimized recoveries for plant residence time) negatively affected the Company, driving Mine OCF and Adjusted EBITDA to approximately $4 million and AISC to $1,367 during Q3 2022, but still allowing the Company to invest nearly $4 million in growth exploration. Year to date, Mako has generated $20 million in Mine OCF, which allowed the Company to invest $8.5 million in growth exploration and repay $7.4 million of debt without the need for external financing. Now that the metallurgical issues have been resolved, we expect a very strong Q4, with an increase in throughput to 600tpd by the end of the quarter with no additional capex and minimal recovery losses. Additionally, the Company expects a significant reduction in AISC, higher net income and record gold sales in Q4 2022.”
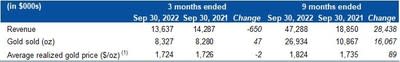
Table 1 – Revenue
|
(1) Realized price before deductions from Sailfish streaming agreement |
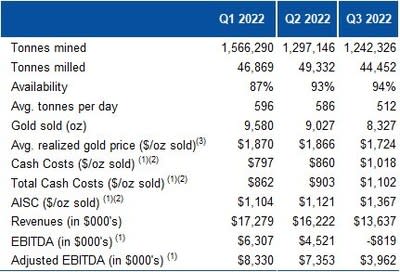
Table 2 – Operating and Financial Data
|
(1) |
Refers to a Non-GAAP financial measure within the meaning of NI 52-112). Refer to information under the heading “Non-GAAP Measures” as well as the reconciliations later in this press release. |
|
(2) |
Refers to a Non-GAAP ratio within the meaning of NI-52-112. Refer to information under the heading “Non-GAAP Measures” later in this press release |
|
(3) |
Realized price before deductions from Sailfish streaming agreement |
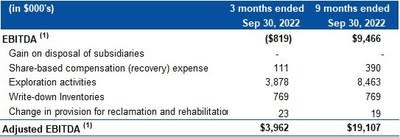
Table 3 – EBITDA Reconciliation
|
(1) |
Refers to a Non-GAAP financial measure within the meaning of NI 52-112. Refer to information under the heading “Non-GAAP Measures” later in this press release. Please refer to the MD&A for detailed calculations. |
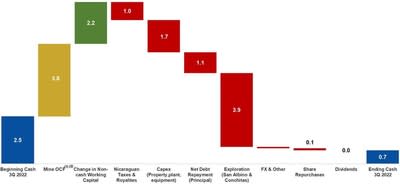
Chart 1
Q3 2022 – Mine OCF Calculation and Cash Reconciliation (in $ millions)
|
(1) |
Refers to a Non-GAAP financial measure within the meaning of NI 52-112. Refer to information under the heading “Non-GAAP Measures” later in this press release. |
|
(2) |
Includes all expenses incurred to sustain operations. Excludes Nicaraguan Taxes and Royalties, changes in Non-cash Working Capital, and Exploration expenses |
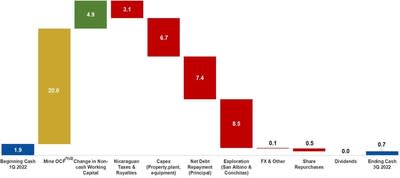
Chart 2
Accumulated 9 months ending Sep 30 – Mine OCF Calculation and Cash Reconciliation (in $ millions)

|
(3) |
Refers to a Non-GAAP financial measure within the meaning of NI 52-112. Refer to information under the heading “Non-GAAP Measures” later in this press release. |
|
(4) |
Includes all expenses incurred to sustain operations. Excludes Nicaraguan Taxes and Royalties, changes in Non-cash Working Capital, and Exploration expenses |
Corporate Update
Depreciation and Depletion
In October 2020, Mako published its National Instrument 43-101 Technical Report and Estimate of Mineral Resources for the San Albino Project. A portion of that published mineral resource formed the basis of our non-cash depletion and depreciation calculation through Q3 2022.
Subsequently, the Company has added certain previously delineated mineral resources into a mine plan and identified additional mineral resources within the San Albino mine area, which are expected to increase the base of the estimated tonnes to be depleted going forward. In addition, we expect that a maiden mineral resource at Las Conchitas (which currently has no carrying value) will be incorporated into a separate mine plan beginning early next year. In this context, we expect to see a materially lower depletion and depreciation expense, and a significant increase in net income starting in Q4 2022.
US Sanctions in Nicaragua
Further to the Company’s press release of October 31, 2022 addressing the October 24, 2022 announcement by the United States Department of the Treasury’s Office of Foreign Assets Controls (OFAC) relating to new U.S. sanctions imposed on the General Directorate of Mines (DGM) pursuant to Executive Order (“EO”) 13851, as well as the issuance of EO 14088 (the “October 24 measures”), following consultations with its US legal advisors, we are taking additional internal measures aimed at ensuring that we are in compliance with the October 24 measures, and although we do not currently expect there to be any material changes to our mining and exploration operations in Nicaragua as a result of the October 24 measures, we are continuing to monitor the situation.
Board of Directors update
The Company also announces that Mr. John Stevens has stepped down as a director of the Company. Mr. Stevens has served as a member of the Mako board for three years, and his contributions have been significant. His previous experience with Latin America, as a senior credit officer for a large financial institution as well as various board assignments, brought a valued perspective to the Company. On behalf of the board of directors, the management team and our shareholders, the Company thanks John for his service and wish him all the best in his future endeavors.
For complete details, please refer to the unaudited interim consolidated financial statements and the associated management discussion and analysis for the nine months ended September 30, 2022, available on SEDAR (www.sedar.com) or on the Company’s website (www.makominingcorp.com).
Non-GAAP Measures
The Company has included certain non-GAAP financial measures and non-GAAP ratios in this press release such as EBITDA, Adjusted EBITDA, Mine Operating Cash Flow cash cost per ounce sold, total cash cost per ounce sold, AISC per ounce sold. These non-GAAP measures are intended to provide additional information and should not be considered in isolation or as a substitute for measures of performance prepared in accordance with IFRS. In the gold mining industry, these are commonly used performance measures and ratios, but do not have any standardized meaning prescribed under IFRS and therefore may not be comparable to other issuers. The Company believes that, in addition to conventional measures prepared in accordance with IFRS, certain investors use this information to evaluate the Company’s underlying performance of its core operations and its ability to generate cash flow.
“EBITDA” represents earnings before interest (including non-cash accretion of financial obligation and lease obligations), income taxes and depreciation, depletion and amortization.
“Adjusted EBITDA” represents EBITDA, adjusted to exclude exploration activities, share-based compensation and change in provision for reclamation and rehabilitation.
“Cash costs per ounce sold” is calculated by deducting revenues from silver sales and dividing the sum of mining, milling and mine site administration cost.
“Total cash costs per ounce sold” is calculated by deducting revenues from silver sales from production cash costs and production taxes and royalties and dividing the sum by the number of gold ounces sold. Production cash costs include mining, milling, mine site security and mine site administration costs.
“AISC per ounce sold” includes total cash costs (as defined above) and adds the sum of G&A, sustaining capital and certain exploration and evaluation (“E&E“) costs, sustaining lease payments, provision for environmental fees, if applicable, and rehabilitation costs paid, all divided by the number of ounces sold. As this measure seeks to reflect the full cost of gold production from current operations, capital and E&E costs…
Read More:Mako Mining Provides Q3 2022 Financial Results and Corporate Update
2022-11-30 12:00:00