
The S&P 500’s strong start to October was just the beginning of a rally that should last through the end of the year, according to JPMorgan technical analyst Jason Hunter.
“While coming [economic] data can change the tone, the recent price action and technical setup suggests the fourth-quarter bounce is under way,” Hunter wrote in a note to clients.
The S&P 500 index’s
SPX,
two-day surge of 5.7% through Tuesday, which was the best two-day start to a quarter in 84 years, triggered a “cluster” of momentum divergence buy signals. Given that those signals coincide with a “deep oversold” technical condition and historically bearish sentiment readings, Hunter believes the rally can continue.
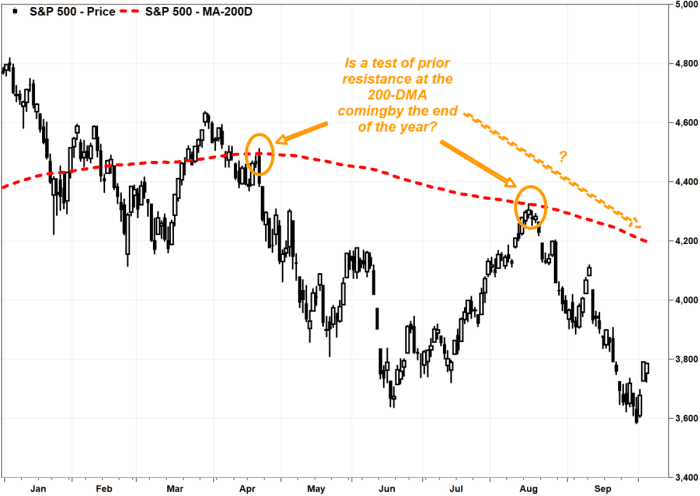
Hunter thinks the bounce could ultimately take the S&P 500 back up to test prior resistance at the 200-day moving average, which many chart watchers view as a dividing line between longer-term uptrends and downtrends. The 200-day extends to 4,199 on Wednesday, according to FactSet, which is about 12% above current levels.
FactSet, MarketWatch
Meanwhile, the S&P 500 slipped 0.2% in afternoon trading Wednesday, but pared an earlier intraday loss of as much as 1.8%.
One reason for Hunter’s bullish view is that the S&P 500’s bounce unfolded from “deep oversold internal breadth” readings, which suggests the number of declining stocks relative to advancers has stretched to levels that coincided with market bounces in the past.
Gail Dudack, chief investment strategist at Dudack Research Group, said just prior to the S&P 500’s big bounce, the 25-day up-down volume technical indicator was at a level associated with an “oversold” condition for 10-straight days, and was at a more extreme oversold reading than at the June low, which preceded a two-month uptrend that took the S&P 500 up 17%.
In addition, the AAII Sentiment Survey of individual investors showed those who were bearish on stocks reached 60.9% during the week ended Sept. 21, the highest percentage seen since the week of March 5, 2009, or just before the S&P 500 bottomed after the financial crisis.
And JPMorgan’s Hunter said the stock market is “poised to potentially confirm a weekly momentum diverging buy signal, (that) historically has had a good hit rate for the S&P 500 index.”
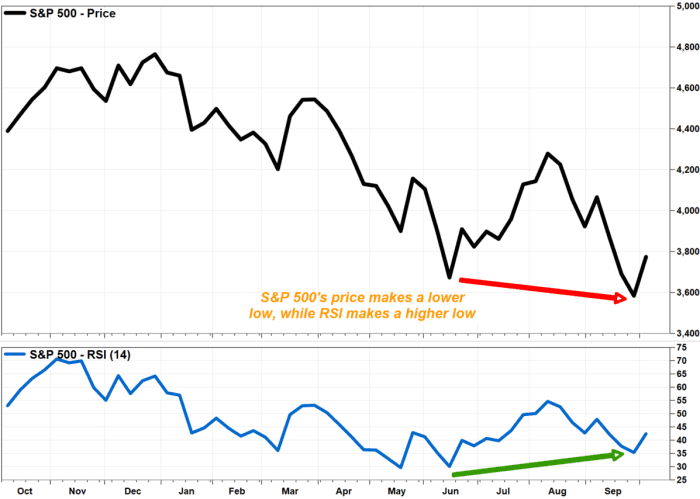
A bullish technical divergence refers to when prices keep trending lower even after some momentum indicators, such as the Relative Strength Index (RSI), have started trending higher. The RSI is a widely followed oscillating indicator that tracks the magnitude of losses relative to the magnitude of recent gains. Read more about how to interpret RSI divergence.
The following chart shows what bullish divergence looks like:
FactSet, MarketWatch
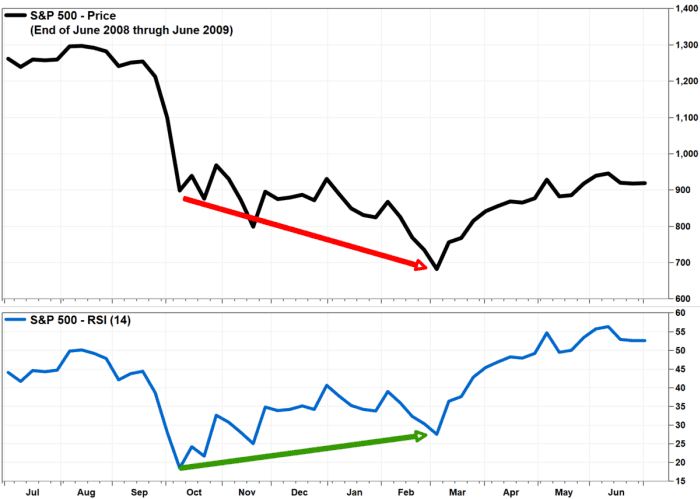
There was a similar divergence as the S&P 500 bottomed in 2009 after the financial crisis:
FactSet, MarketWatch
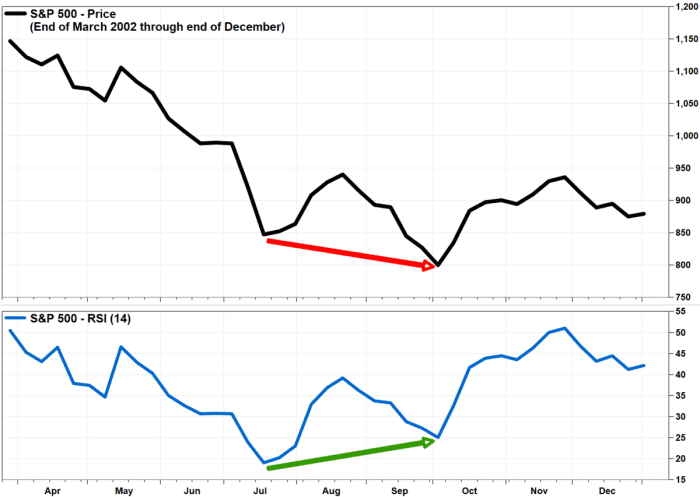
And another divergence as the market bottomed in 2002 after the internet bubble popped:
FactSet, MarketWatch
JPMorgan’s Hunter said he believes sustained daily closes above resistance at the Sept. 28 intraday high at 3,736 — the S&P 500 is set to close above that for a second-straight day — would keep momentum positive, and target the next resistance area at 3,900.
He believes the 4,100-to-4,200 zone, which the 200-day will likely decline into during the fourth quarter, could act as a “meaningful barrier.”
Read More:Why this chart watcher thinks the stock market’s year-end bounce is under way
2022-10-05 18:50:00