
Olivier Le Moal
Dollar strength and negative sentiment weighed on gold in July
July highlights
- As US dollar strength continued and inflation expectations softened, the gold price fell, gold ETFs lost 81t (US$4.5bn), and speculative positions in gold futures turned net short for only the fifth time since 2006(p.1).
Looking forward
- The market reaction to the July Fed meeting may encourage a more sustained fall in the US dollar and run up in risk assets. This could benefit gold but may also risk strengthening the Fed’s resolve (p.2).
- Historical analysis suggests that current futures market positioning in gold, the US dollar and US 10-year Treasury combined could signal a good probability of positive forward returns for gold (p.2-3).
The dollar was strong and gold investment weak
Gold fell 3.5% in July, leaving it down 2.9% on the year at US$1,753/oz. 1 A strong US dollar and sticky real yields weighed on gold in the first half of July. But softer inflation expectations mid-month and Jobless Claims a few days later in the US nudged the dollar and real rates down. These reversals also coincided with extended positioning in futures markets for currencies, gold and to a lesser extent, rates. Having faced a 6.2% drop mid-month, gold rallied to finish the month down only 3.5% (Table 1).
Our Gold Return Attribution Model (GRAM) (Chart 1) suggests that gold’s performance was influenced by:
- Momentum: Significant outflows from global gold ETFs and a further drop in gold futures positioning, reaching net short for only the fifth time since the series was introduced2
- Risk and uncertainty: Weaker Brent crude prices on softer growth data and lower implied volatility also contributed to gold’s weakness
- Opportunity cost (FX): Continued dollar strength, which only reversed in the second half of the month
- Opportunity cost (rates): Falling bond yields, on weaker growth expectations in the latter part of the month provided a boost to gold.
Chart 1: A stronger dollar and continued investor outflows weighed on gold in July
Contributions of gold price drivers to monthly gold returns*
Bloomberg, World Gold Council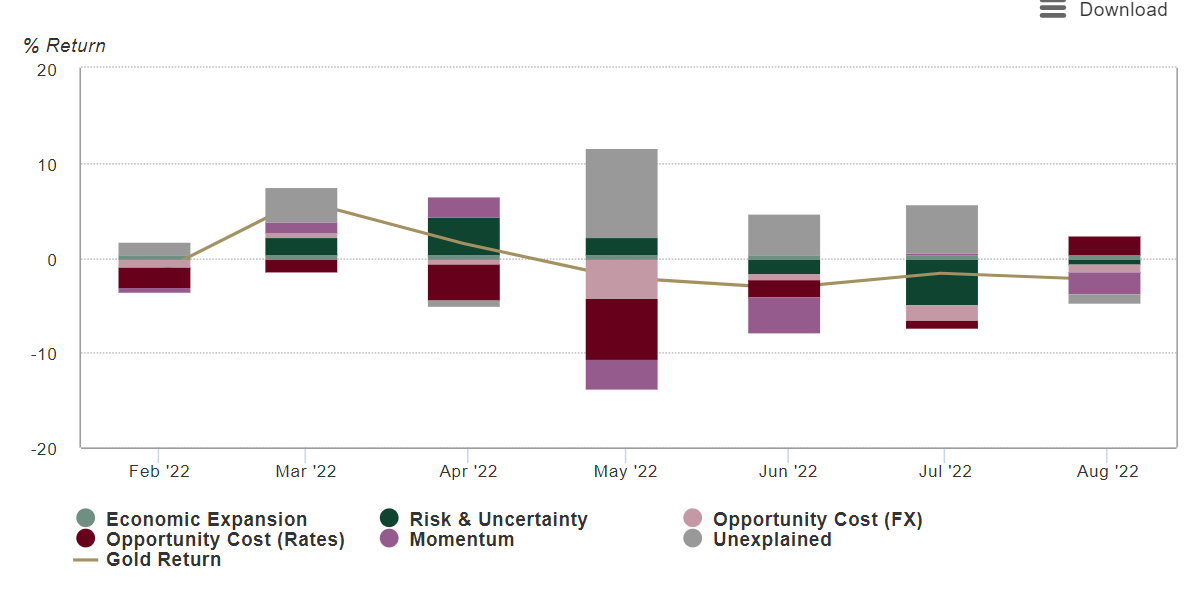
*To 31 July 2022. Our short-term model is a multiple regression model of monthly gold price returns, which we group into the four key thematic driver categories of gold’s performance: economic expansion, risk & uncertainty, opportunity cost, and momentum. These themes capture motives behind gold demand; most significantly, investment demand, which is considered the marginal driver of gold price returns in the short run. ‘Unexplained’ represents the percentage change in the gold price that is not explained by factors currently included in the model. Results shown here are based on analysis covering an estimation period from February 2007 to June 2022.
Table 1: Gold prices rebounded in the latter part of July but not enough to offset earlier losses
As of 31 July 2022. Based on the LBMA Gold Price PM in local currencies: US dollar (USD), euro (EUR), Japanese yen (JPY), pound sterling (GBP), Canadian dollar (CAD), Swiss franc (CHF), Indian rupee (INR), Chinese yuan (RMB), Turkish lira (TRY), Russian rouble (RUB), South African rand (ZAR), and Australian dollar (AUD). (Bloomberg, ICE Benchmark Administration, World Gold Council)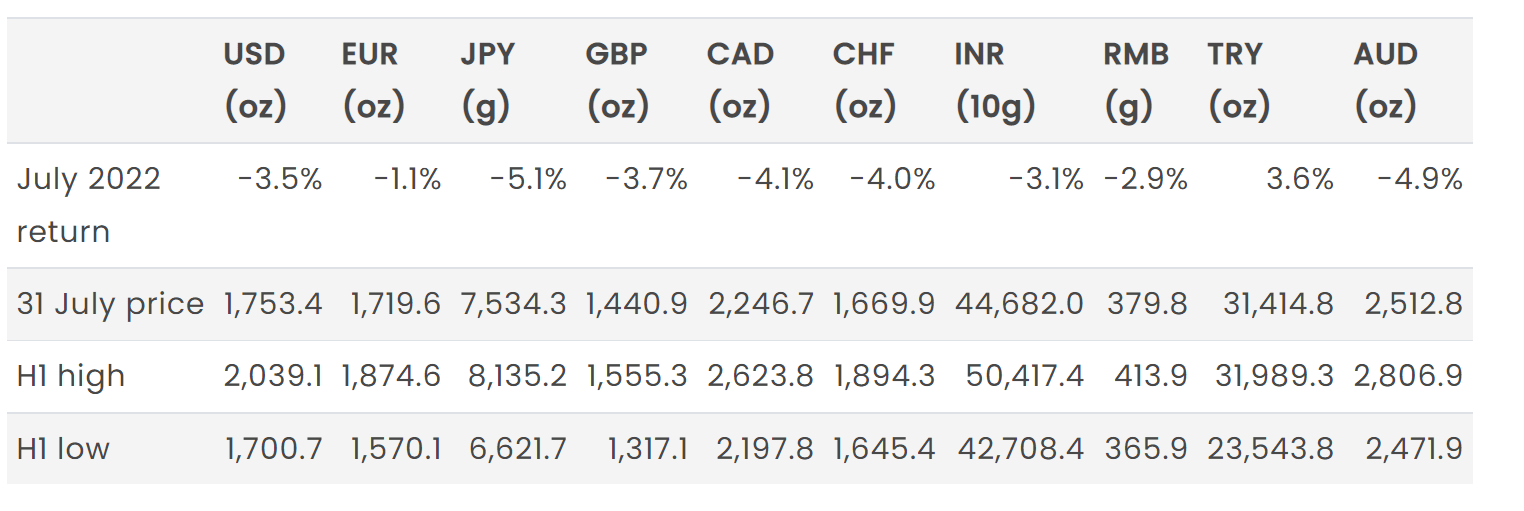
Looking ahead…
- Expectations of a less hawkish US monetary policy environment and high investor cash allocations may weaken the dollar and trigger a more sustained recovery in equities and commodities.
- In addition, our historical analysis of futures positioning in gold, the US dollar and 10-year Treasury bond suggests gold could further rebound further in the near future.
A more sustained rally in equities and commodities
Nuance played a big part in the late-July FOMC meeting statement. An unusually large rate hike (+75bps) and consistently firm language on inflation was largely dismissed by markets. Instead, noting future data dependence vs forward guidance and the slim potential for a slower pace of hikes towards the end of the year, the dollar promptly sold off and equity markets saw some of the strongest one-day rallies since 2020.
The most recent Bank Of America (BoFA) fund manager survey, released more than a week prior to the Fed meeting, painted sentiment as ‘dire’ and the proportion of managers willing to take on more risk reached an all-time low. Also notable in the report was that cash as a share of total portfolio holdings was at its highest since 2001. Although causality isn’t clear, this may explain the dollar’s recent strength.
It may also present an opportunity. After all, sentiment tends to mean revert. Extended positioning in the futures market coupled with deployment of these cash allocations could give a boost to risk-asset inflows in conjunction with a weaker dollar.
But it could also backfire for markets and test the resolve of the Fed, whose belief is that bringing demand back into balance with supply is necessary to combat inflation. All in all, a weaker dollar would be welcome for gold investors, but a reflationary environment could be a headwind, especially if it led to the Fed reasserting itself.
Extracting signals from the futures market
In the middle of July, managed money positioning in gold futures turned net short for only the fifth time since the series was introduced in 2006 (Chart 2). We find futures positioning data a historically useful gauge of speculative sentiment in gold, particularly at the extremes.
Net shorts in gold futures have historically been associated with positive gold returns going forward. For example, on a three-month horizon, they have been positive 88% of the time, with this figure rising to 95% and 100% on a six-month and 12-month forward basis, respectively.3 However, the rarity of a net short means that we have only a handful of observations on which to base our inference.
Chart 2: Gold returns following extreme net shorts are overwhelmingly positive
Forward three-month spot gold return in US$ given net long positioning*
Gold net long is calculated as managed money net long as a share of open interest. (Bloomberg, World Gold Council)
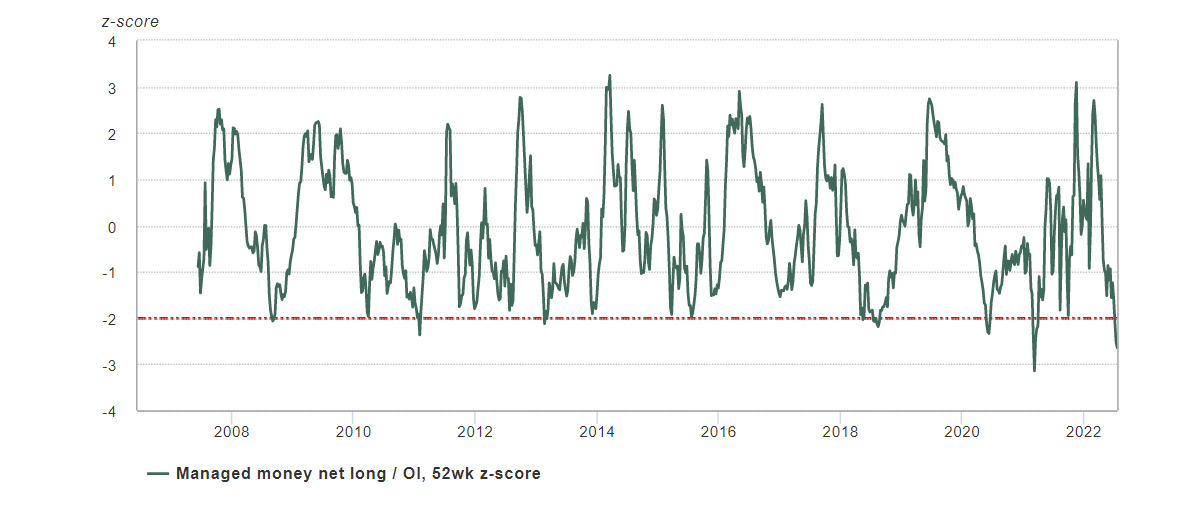
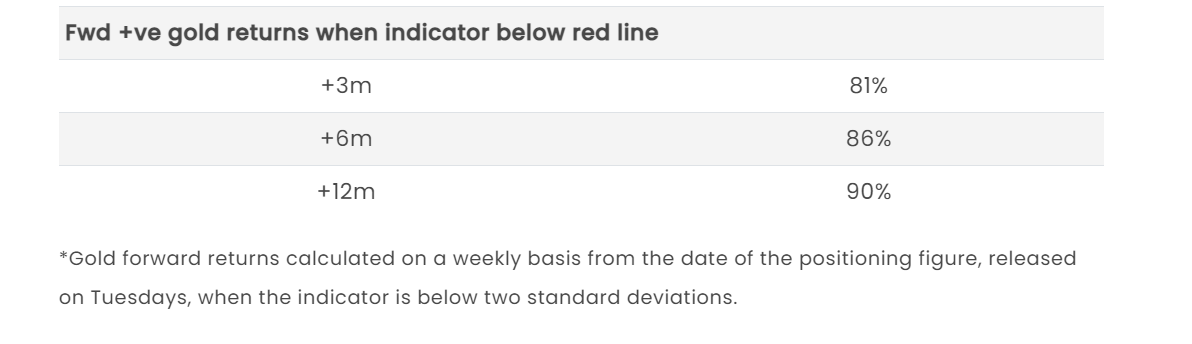
Alternatively, looking at standardised (z-score) positioning increases the number of observations (Chart 3). This adjustment provides more frequent and stable oscillations, as well as more compelling results. Our analysis suggests that when standardised managed future positioning is two standard deviations below its long-term average, forward gold returns are positive between 81% to 90% of the time across 3- to 12-month horizons, suggesting strong mean reversion in sentiment which can help drive gold higher.
Chart 3: Forward gold returns overwhelmingly positive when positioning is at an extreme low
In addition, we might also get a steer from positioning in some of gold’s important drivers: the US dollar and 10-year Treasury futures. Positions in the US dollar and US 10-year Treasuries are close to net long and net short extremes, respectively (Chart 4).4 Historical analysis suggests that reversals from such extremes are common and they have overwhelmingly resulted in positive returns for gold in subsequent months.5
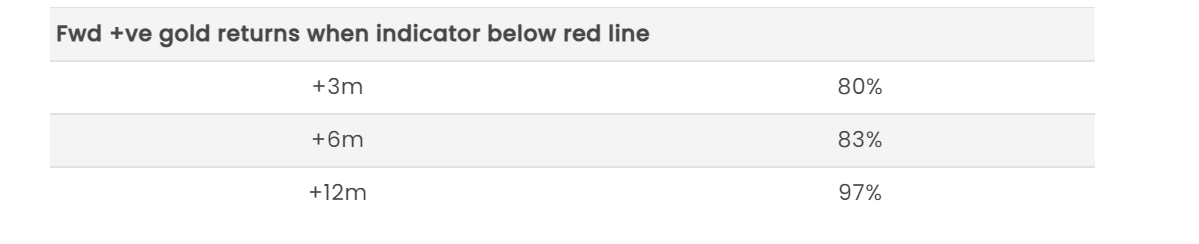
Combined, these metrics suggest that when their average positioning is below -50%, returns for gold have been positive 80-97% of the time over the following three to 12 months (Chart 5). We urge some caution here, however. Futures activity represents only a portion of total volume in the respective markets. As such these signals should be viewed in conjunction with other metrics.
Chart 4: Positioning in the US dollar and US 10-year Treasury futures also at or near extremes
US dollar index future and US 10-year Treasury future net long calculated as ((non-commercial + non-reportable)/open interest). ( Bloomberg, World Gold Council)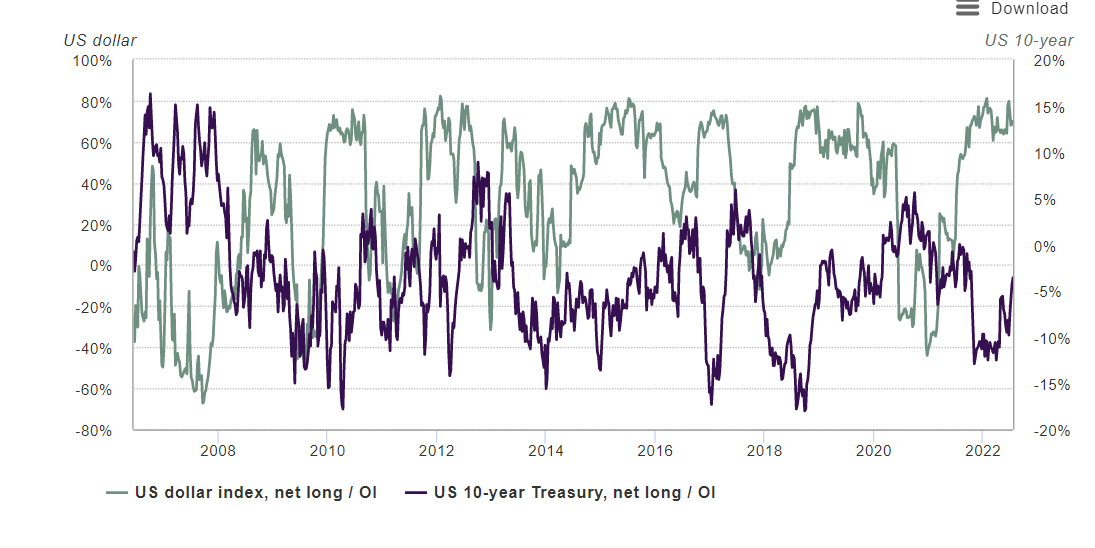
Chart 5: Positioning in gold, the US dollar (inverted) and 10-year Treasury is at an extreme low. This has historically coincided with positive forward gold returns
Bloomberg, World Gold Council Average net long as a share of open interest in gold (GC) – 52wk z-score, US dollar index (DX): calculated as (1 – net long), and US 10-year Treasury future (TY). For gold, net long is calculated as managed money net long as a share of open interest. For the dollar and Treasury positioning, legacy speculative positioning is used: net non-commercial and non-reportable long as a share of open interest. The z-score for gold means it has a larger weight than the other two series given that their positioning values range from -100 to 100% while the gold z-score ranges from -314 to 325%, which we deem appropriate to reflect the importance of gold positioning in the combined analysis.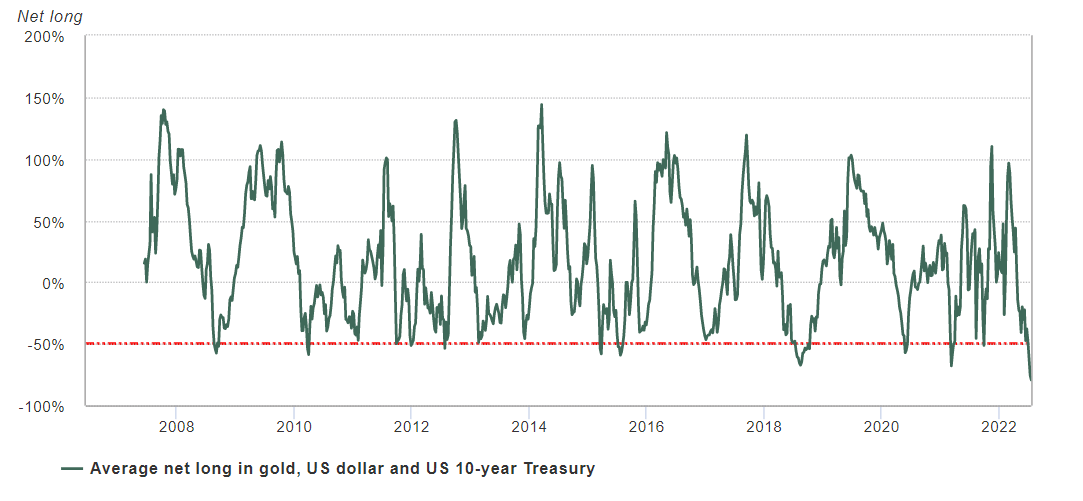
Regional insights
China: China’s gold demand was robust in July. First, total holdings in Chinese gold ETFs saw a notable rise, mainly driven by opportunity-buying amid a lower local gold price combined with risk-off sentiment and higher safe-haven demand as the local stock market fell. Second, a rising monthly average Shanghai-London gold price spread, elevated physical gold trading volumes at the Shanghai Gold Exchange, and our conversations with gold manufacturers all point to stronger wholesale physical gold demand. For more details, please stay tuned for our monthly blog on China.
India: Retail demand remained tepid in July due to muted rural demand, the wedding season drawing to a close and the higher import duty on gold. Retail demand saw marginal improvement during the third week of the month due to a correction in the domestic gold price, however, consumers held back purchases in expectation of a further correction to come. Wholesale demand saw decent activity as jewellers replenished stocks ahead of the India International Jewellery Show (IIJS), and this coincided with a correction in the local gold price.6 With healthy wholesale demand, the local discount narrowed to US$1-2/oz by month-end compared to a discount of US$23-24/oz at start of the July. Indian gold ETFs witnessed net outflows…
Read More:Gold Market Commentary | Seeking Alpha
2022-08-06 17:27:00