
mixmotive/iStock Editorial via Getty Images
It feels like we are battling the mythical nine-headed hydra, but with three heads, one being inflation, two being recession, and the third being “how long can S&P 500 earnings estimates hold up?”
With the May ’22 jobs number this morning, it seems like almost no one mentioned that “average hourly earnings” came in +0.3% vs. the expected +0.4%.
It’s unlikely energy (i.e., crude oil) or food price pressure will relent anytime soon, but the expectation is that the other components will begin to weaken gradually (at least the Fed Governors keep telling us that). The May CPI is due out Friday June 10th, before the opening bell, and overall CPI is expected at +0.7%, while core CPI is expected to come in at +0.5%, down from the prior +0.6%. The next week, June 15th, is the next FOMC meeting, and the expected fed funds boost by 50 bp’s to the 1.50% range.
The 3,800 level held on the S&P 500, (actually 3,810 was the low on May 20th) which is the key 1/3rd retracement level for the S&P 500 according to a lot of the good technicians.
The cautious comments on Apple (AAPL) today by Katy Huberty of Morgan Stanley sent the stock down -3.8%, but it couldn’t even get to average volume. Here’s a quick look at the forward EPS and revenue estimate revisions for Apple:
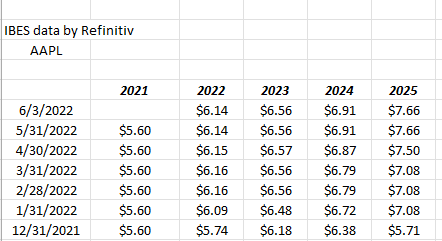
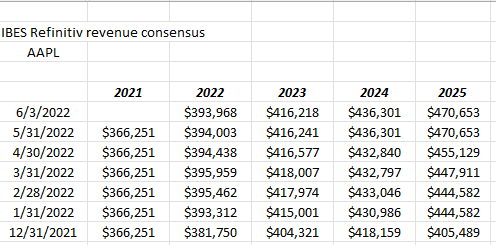
Note the revisions from 2022 forward: still look okay. Some of the other FAANG members look far, far worse. Not much damage here, though (yet).
S&P 500 data from TWIE and the earnings scorecard: (IBES data from Refinitiv)
- The forward 4-quarter estimate jumped this week back up to $235.17 from last week’s $233.49.
- The PE ratio on the forward estimate was 17.5x versus last week’s 17.8x;
- The S&P 500 earnings yield rose to 5.72% this week versus the 5.62% last week;
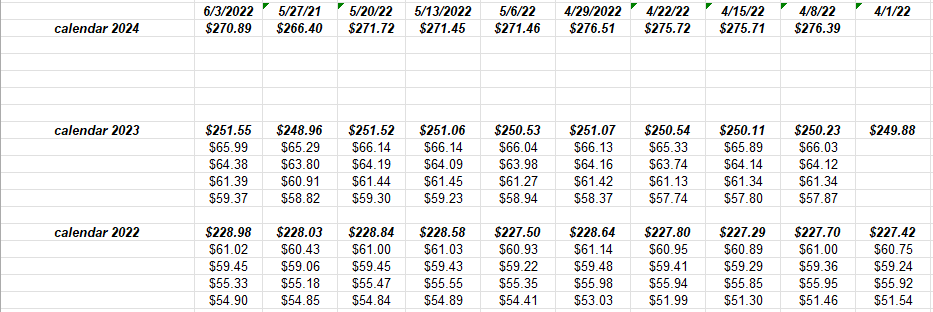
Here’s a part of the earnings spreadsheet (see spreadsheet above this sentence) not shown too much: it’s the annual S&P 500 EPS estimates with the quarterly bottom-up estimates.
Look at Q1 ’22: since April 1, ’22 or the near start of Q1 22 earnings, the bottom-up quarterly estimate has risen 6.5% which is the normal or higher end of the typical “surprise” factor. Q2 ’22 hasn’t budged at all. And it usually doesn’t until after July 1, ’22.
We (readers / investors) are returning to the normal typical pattern of S&P 500 earnings estimates, and it will become more so after the Q2 ’22 results are in since it will be the last quarter of gross Covid distortion we will see. In Q2 ’21, S&P 500 EPS grew 96%, while S&P 500 revenue grew 25%. Doubtful, we’ll see that compare for a while.
Watch credit spreads: Credit “risk” rallied sharply last week, along with the S&P 500’s 6% gain. It’s been hard to determine this year in the corporate high-yield and high-grade bond space how much of the price downside has been duration-related and how much has been expected credit deterioration. With econ data holding up and S&P 500 earnings holding up, you have to assume much of the deterioration in price in those vehicles was interest-rate related. The LQD and Bloomberg’s investment-grade corporate bond proxies started 2022 with durations over 9%. It was tough to own that asset class for clients, and we didn’t and took credit risk in the short-term high-yield bond ETF SHYG and the Nuveen’s municipal high-yield and short-term high-yield funds, but sold all that by early April, ’22.
In 2007 and 2008, interest rates were falling, but credit spreads were widening. In 2022, interest rates are rising and credit spreads are widening too.
Neither the LQD, the AGG or Pimco’s BOND fund ETF have been able to recover, their downward-sloping 50 day moving average. They bounced right off its last week, with the average acting as resistance.
Top 12 Holdings as of 5/31/22:
- Schwab money market fund
- Blackrock Strategic Inc Fund: -3.70% YTD
- S&P 500 Equal Weight ETF (RSP): -8.11% YTD return
- JP Morgan Income Fund: -4.62% YTD return
- Microsoft (MSFT): -18.79% YTD return
- Oakmark International: -9.90% YTD return
- Charles Schwab (SCHW): -16.17% YTD return
- Tesla (TSLA): -28.25% YTD return
- JPMorgan (JPM): -15.23% YTD return
- Merck (MRK): +21% YTD return
- Pfizer (PFE): -8.82% YTD return
- Amazon (AMZN): -28% YTD return
As of May 31, the SPY was down -12.79% and the AGG was lower -8.74%. A 60% S&P 500 / 40% AGG balanced benchmark portfolio was lower YTD by -11.17%.
Summary / conclusion: No question the range of outcomes for various asset class returns for retail investors has increased dramatically in 2022, but with the Fed / FOMC looking at two consecutive 50 bps fed funds rate hikes on June 15th and then again in July, has clients sitting on more cash than usual. With recession risk growing, clients were told that they would likely see more positions that outperform under economic duress, with those ETFs or funds or securities added after each rate hike.
As to how long S&P 500 earnings hold up, Apple was a good example today of what one downgrade can do to a stock in a tough tape. EPS and revenue estimates are still seeing positive revisions and yet the stock is 16% from its $180 all-time-high.
There are few places to hide in this market, with the dollar (UUP) being one, gold is flat to 2% higher in 2022, and then cash / money markets.
It’s been hard to diversify accounts for clients in 2022: as 2022 started, client accounts had 10% – 12% in either the Oakmark International Fund or the EMXC (emerging markets ex-China ETF) and both are negative YTD, with Oakmark Int’l thanks primarily to Ukraine and its impact on Europe and EMXC thanks to China’s issues around other emerging markets.
Value funds are even down on the year. Bill Nygren at Oakmark is great value investor, and as of 5/31/22, his fund was down -8.5% in 2022.
None of this is a recommendation or suggestion to buy or sell. Client holdings can change quickly, and past performance is no guarantee of future results. Capital market conditions can change quickly. Do your own homework and evaluate your own risk appetite towards capital market volatility.
Personally, I don’t think this is a repeat of 2001 – 2002 or 2007 – 2008, but the following events would be worrisome either together or separate:
1.) The 10-year Treasury yield trading up through the 3.16%, May 9th high yield print;
2.) Crude oil trading up through the $130 – $131 high from early March ’22;
3.) The S&P 500 trading and closing below 3,800 on heavy volume.
Thanks for reading.
Editor’s Note: The summary bullets for this article were chosen by Seeking Alpha editors.
Read More:S&P 500 Earnings: Forward Estimate Jumps – The ‘Inflation Vs. Recession Risk’ Market
2022-06-04 17:14:00