
alexsl/iStock via Getty Images
Emerging markets are always an intriguing place to seek alpha. My formative investing years were 2004-2008 – a period in which the niche sharply outperformed both U.S. stocks and foreign developed markets. After peaking in relative performance in 2010, the iShares Emerging Markets ETF (NYSEARCA:EEM) has been a painful position for investors overweight the region over the last decade. Opportunity cost has been real considering the Select SPDR S&P 500 ETF (SPY) is up hundreds of percent in that time.
Since Nov 2010: SPY +332%, EEM +12%
Stockcharts.com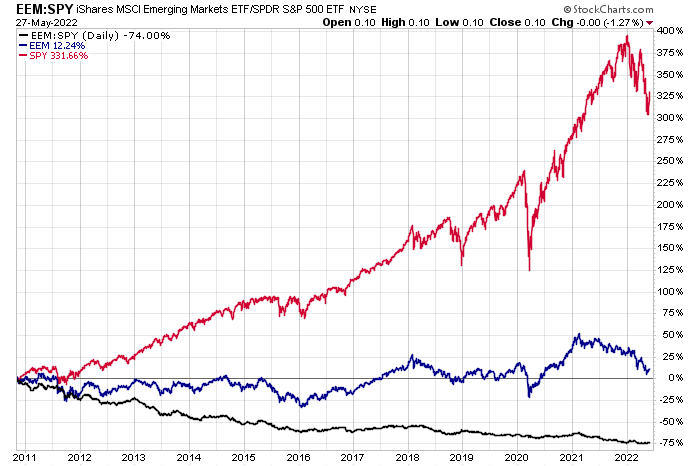
EEM Peaked vs SPY In Late 2010
Stockcharts.com
Today’s emerging market composition is far different from 15 years ago. According to J.P. Morgan Asset Management, at 11% of the global equity market, the niche is still a small piece of the pie. And it used to be that energy, materials, and other dollar-sensitive areas dominated price action among EM nations. Resource-rich countries such as Brazil, Russia, Australia, South Africa, and others, drove huge gains in the mid-2000s. Fast-forward to 2022, and Technology and Financials are the big players – right as commodities have re-asserted their prominence. Markets can be cruel.
Not Your Father’s EM: 11% of the Global Stock Market
J.P. Morgan Asset Management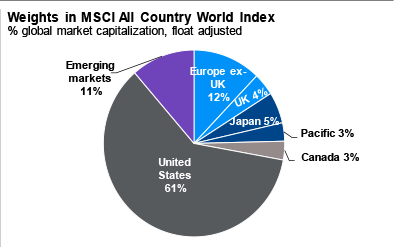
Emerging Markets Composition: Financial & Tech These Days
J.P. Morgan Asset Management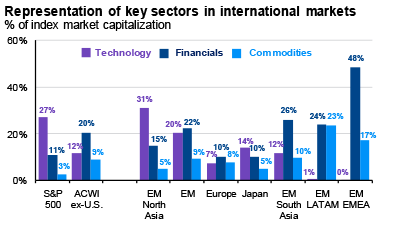
What has boomed over the last decade-plus has been the emerging market fixed income space. EM bonds are now about 25% of the global fixed income market. That makes the health of EM nations all the more important in the years ahead. Credit cycle booms and busts could be more pronounced over the coming decade since EM nations are infamous for their political uncertainty and sharp economic cycles. The EM bond market, priced in U.S. dollars, yields more than 7% right now, helping to boost global fixed income yields, according to J.P. Morgan Asset Management.
EM debt Is Now 25% of the Global Bond Market. Up From 1% In 1989
J.P. Morgan Asset Management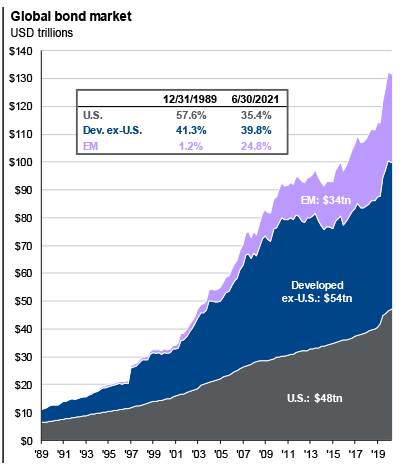
On valuation, emerging markets look downright cheap at just an 11.1 forward price-to-earnings ratio, according to data compiled by Ed Yardeni. Contrast that to a 14.7x global earnings multiple and 17.0x here in the U.S.
Global Equity Market Valuations: EM Is Least Expensive
Yardeni.com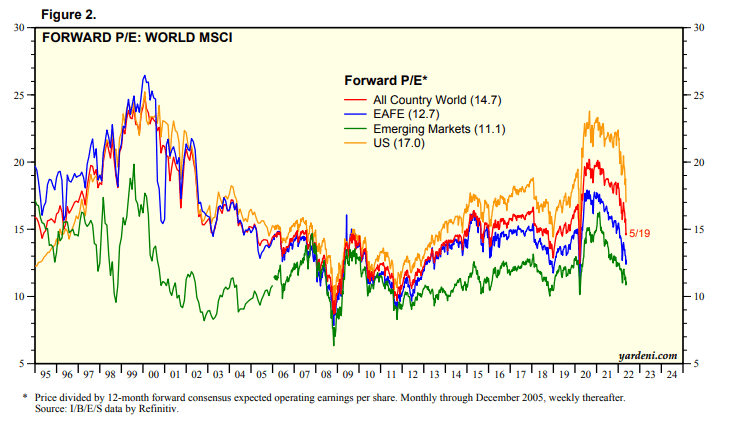
Still, EM’s forward P/E is near its 25-year average, according to J.P. Morgan Asset Management, despite the massive price weakness seen since the 2007 peak.
EM Valuations Seem Cheap, But Not By Historical Standards
J.P. Morgan Asset Management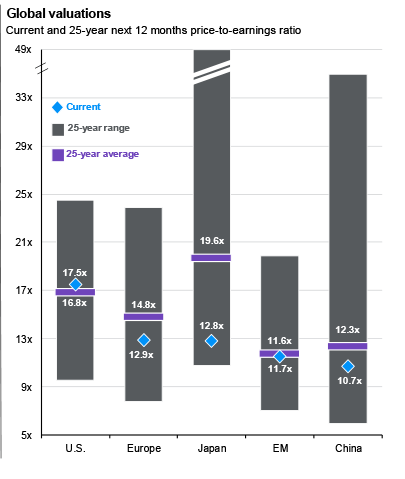
“Bear” in mind that emerging markets’ earnings per share actually peaked more than a decade ago. Forward estimates have also come down for calendar-year 2022 and 2023.
EM EPS Is Roughly Unchanged Since 2007
Yardeni.com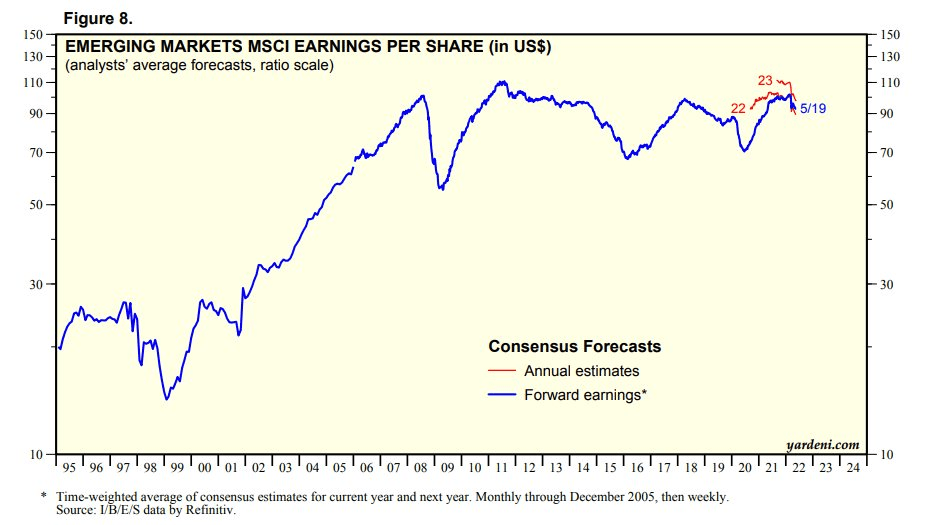
The Technical Take
Long-term, there is decent support just below where EEM trades right now. The problem is the below chart is without trend. For a seriously bullish case to be made, investors want to see higher lows and higher highs. EEM has been in a secular bear market off the 2007 high. It will likely take a long time before we have clear evidence of an established uptrend. For now, buying the dip in the $36-$37 area for a trade makes sense, but short-term buyers should sell on solid rallies.
For a Trade: EEM Support in the $36-$37 Range
Stockcharts.com
Don’t Go with EEM Though
The iShares Emerging Markets ETF has a huge expense ratio of 0.68%, according to iShares. Investors are much better served owning competitor ETFs like VWO or SPEM which are more than 0.5% cheaper. You can also go with a lower-cost version of EEM offered by iShares: IEMG.
EEM’s High Fees Lead to Lower Returns vs Comparable Funds
Stockcharts.com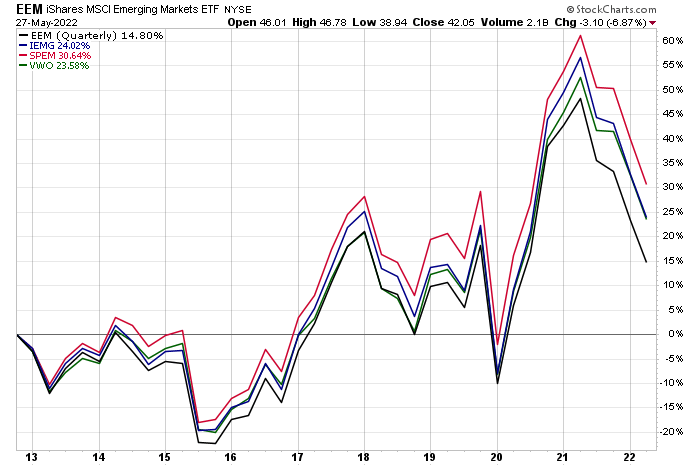
The Bottom Line
For long-term investors, the valuation case looks good and from this big base should eventually come big returns. Considering that EM is 11% of the global market, retirement savers should have about that weight within their equity allocation.
Don’t buy EEM for a long-term holding though. Go with Vanguard Emerging Markets Stock Index Fund ETF (VWO), the SPDR Portfolio Emerging Markets ETF (SPEM), or the iShares Core MSCI Emerging Markets ETF (IEMG).
Read More:Emerging Markets EEM ETF: A Bullish Short-Term Opportunity
2022-05-30 16:34:00