

jetcityimage/iStock Editorial via Getty Images
If everybody indexed, the only word you could use is chaos, catastrophe… the markets would fail.
– John Bogle, May 2017
Try to buy assets at a discount rather than earnings. Earnings can change dramatically in a short time. Usually, assets change slowly. One has to know much more about a company if one buys earnings.
– Walter Schloss
Introduction
Energy equities have outperformed significantly year-to-date in 2022, with the Energy Select Sector SPDR Fund (XLE) up 45.3% in 2022. This compares very favorably to a 7.5% YTD decline in the SPDR S&P 500 ETF (SPY), a 14.8% decline in the Invesco QQQ Trust (QQQ), a 18.2% decline in the iShares 20+Year Treasury ETF (TLT), and a 37.6% decline in the ARK Innovation ETF (ARKK).
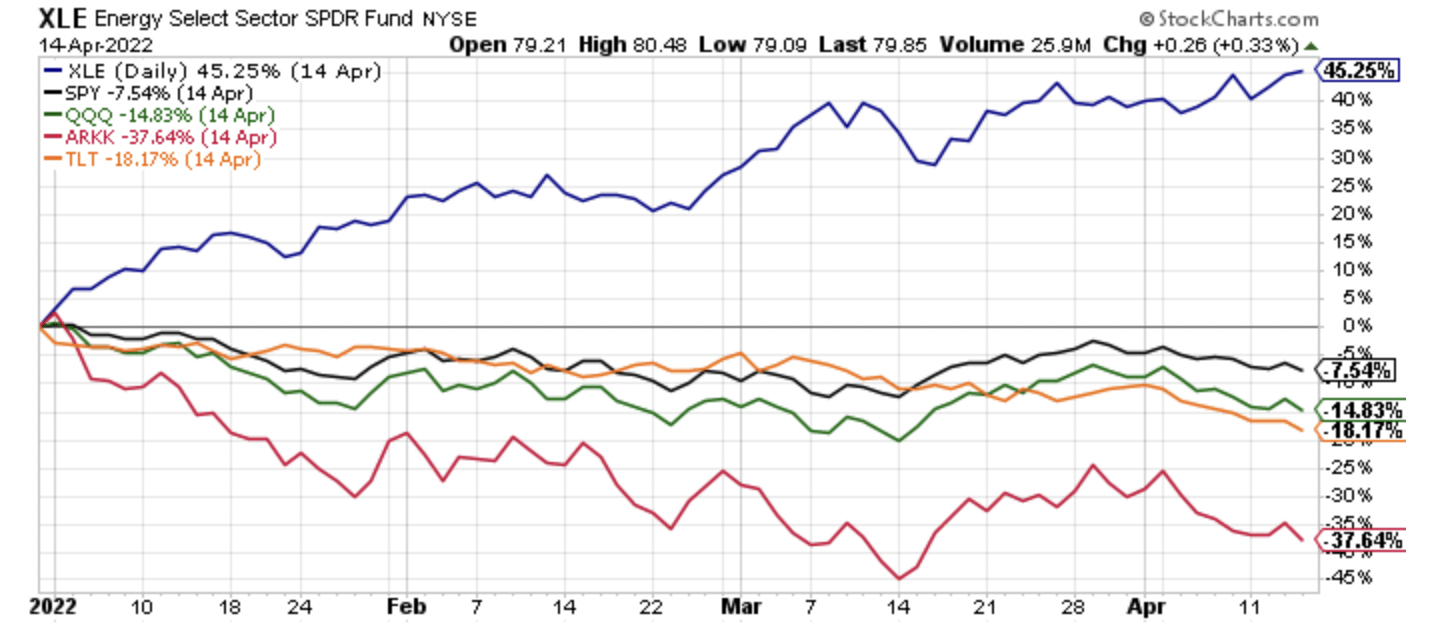
XLE SPY QQQ TLT ARKK (Author, StockCharts)
Growth stocks, led by the momentum growth favorites that dominate ARKK, have been severely impaired, held back by their poor starting valuations, something I wrote about in detail on August 10th, 2021, with the article titled, “ARKK Implosion Is On The Horizon.” Since that article was published, ARKK shares are down 51.2%, vs. a 1% decline in the S&P 500 Index (SP500), as illustrated in the image below.
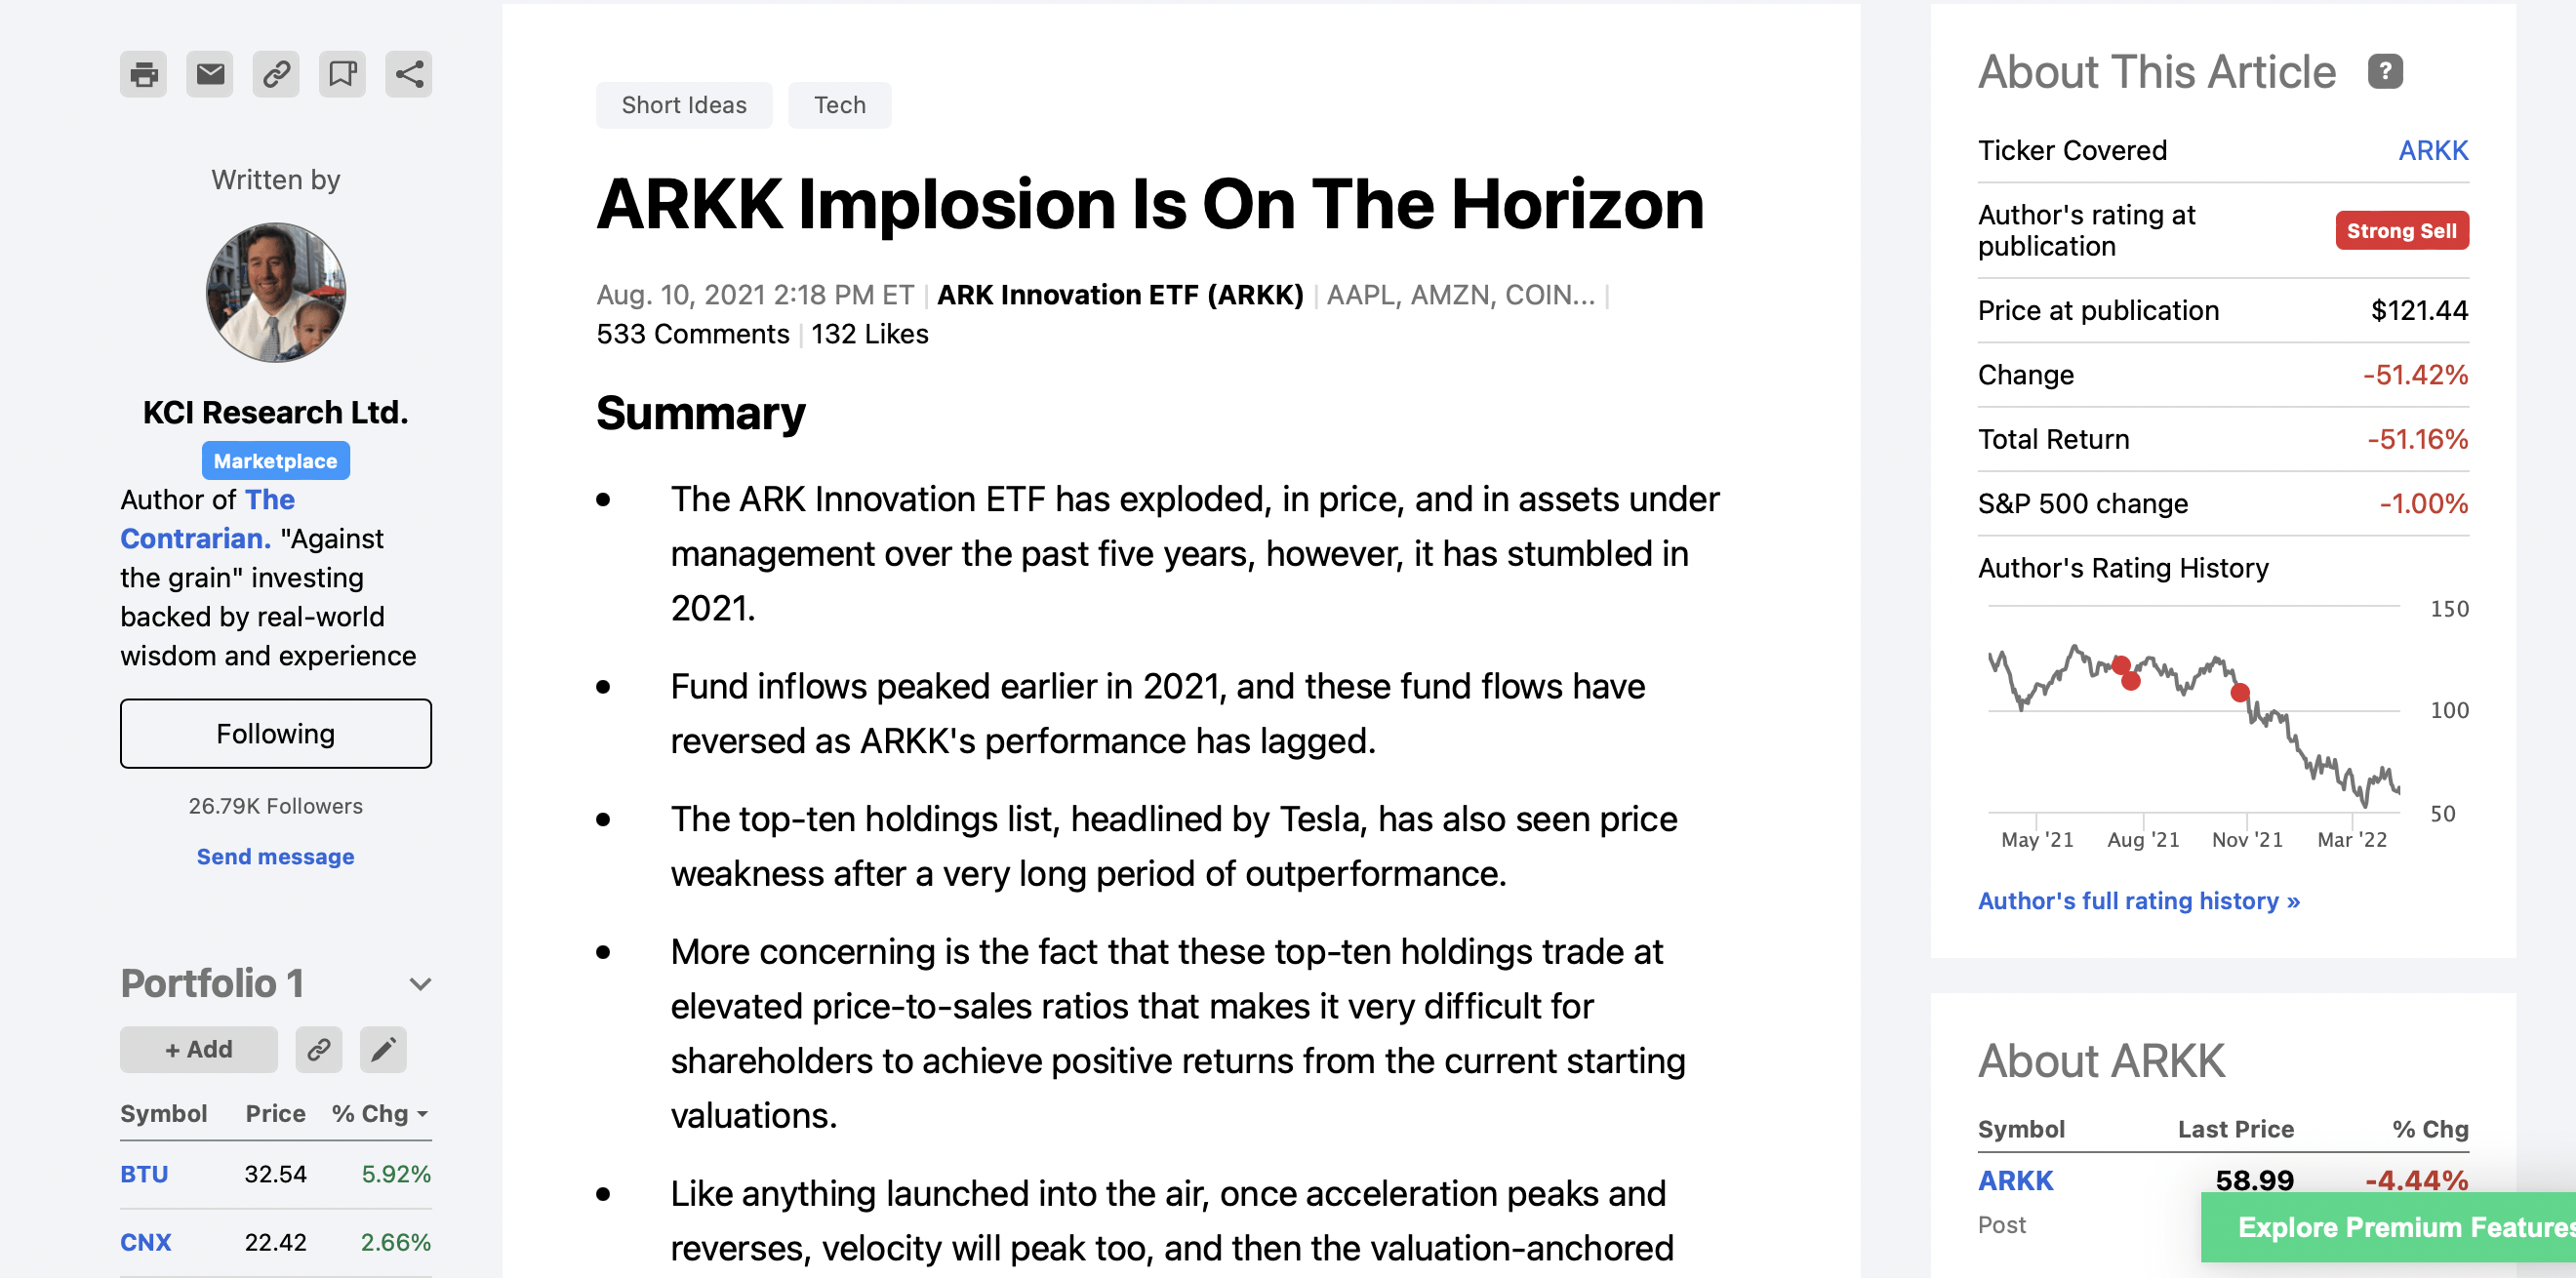
Author’s August 10th, 2021 Article Snapshot (Author, Seeking Alpha)
Obviously, growth stocks are struggling, as rising interest rates the yield curve, but particularly at the longer end of the yield curve, reduce the appeal of the longest duration assets.
On the opposite side of the ledger, high free cash flow yielding companies are being rewarded, and many of these free cash flow standouts reside in the commodity equity sector. Taken together, a historical capital rotation is underway. This is something I have chronicled on a regular basis, documenting the flow of money from the “Have’s” to the “Have Not’s.” These public articles below reference this historical capital rotation.
Adding to the narrative, with this public article, I outlined how removing Exxon Mobil (XOM) from the Dow Jones Industrial Average (DIA) and replacing the venerable, longest listed Dow Jones component with Salesforce.com (CRM) in August of 2020 would turn out to be a high water marker for the current state of the financial markets. The share price performance of Exxon and Salesforce.com shares since that removal date says everything that you need to know about the financial markets since August 2020.
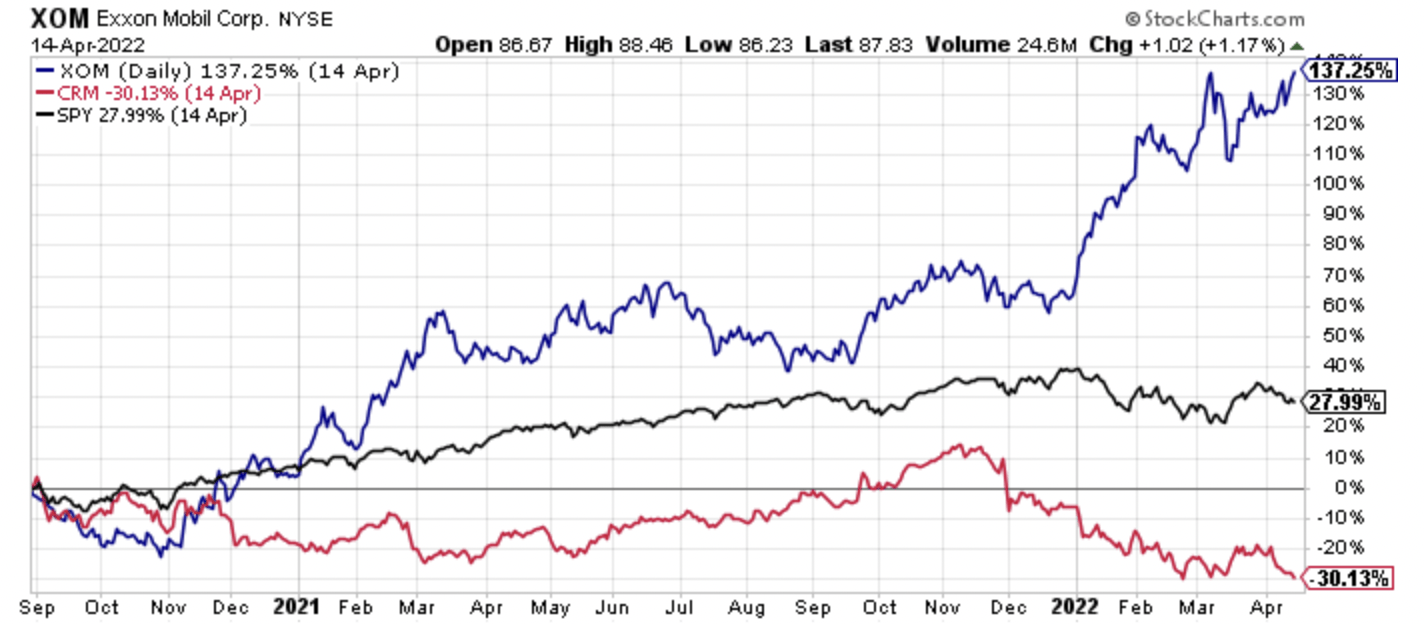
XOM Versus CRM Performance Since XOM Was Replaced By CRM In The DJIA (Author, StockCharts)
Looking at the chart above, Exxon Mobil shares have strongly outperformed Salesforce.com shares since Exxon was removed from the DJIA and Salesforce.com shares were added. Let’s not forget that the active decision makers at S&P Global (SPGI) removed Exxon and added Salesforce.com because they thought that Salesforce.com was more representative of the future of the market. This happened even though the economic impact of Exxon Mobil was far greater at the time of the switch, and that gap has increased today as Exxon’s revenues, net income, and free cash flows have surged with higher energy prices.
With the benefit of hindsight, almost all market participants were crowded on one side of the boat, overweighting technology shares, and underweighting the left behind value stocks, particularly the downtrodden commodity equities.
The best example of this seismic shift in the investment landscape has been in the performance of natural gas equities, which have trounced their vaunted FAANG peers in performance terms, across a range of time frames dating to January 1st, 2020, as I will illustrate below in the body of this article, which is an updated fourth edition to my February 3rd, 2021 article, “Off To The RACES: Natural Gas Equities Lapping FAANG Stocks, the May 26th, 2021 follow-up, and then the September 10th, 2021 third edition.
As we approach the month of May, which is racing season in Indianapolis, the favored natural gas equities, which I have coined with the term RACES, which is the first letter of each of the equities profiled more in-depth below, are the best performing, most obscure corner of the market, that most investors have ignored, until recently. With the current slingshot higher in prices, many investors are now acknowledging, appreciating, and buying into natural gas equities and related equities as investment candidates, recognizing that their free cash flow estimates are surging on the back of higher natural gas, and natural gas liquids prices.
Off To The RACES Stocks Are Way Ahead Of FAANG Since The Start Of 2020 And The Gap Is Widening
The following performance chart shows the total return of Range Resources (RRC), Antero Resources (AR), CNX Resources (CNX), EQT Corp. (EQT), Southwestern Energy (SWN), and the SPDR S&P 500 ETF (SPY) since January 1st, 2020 through Thursday, April 14th, 2022.
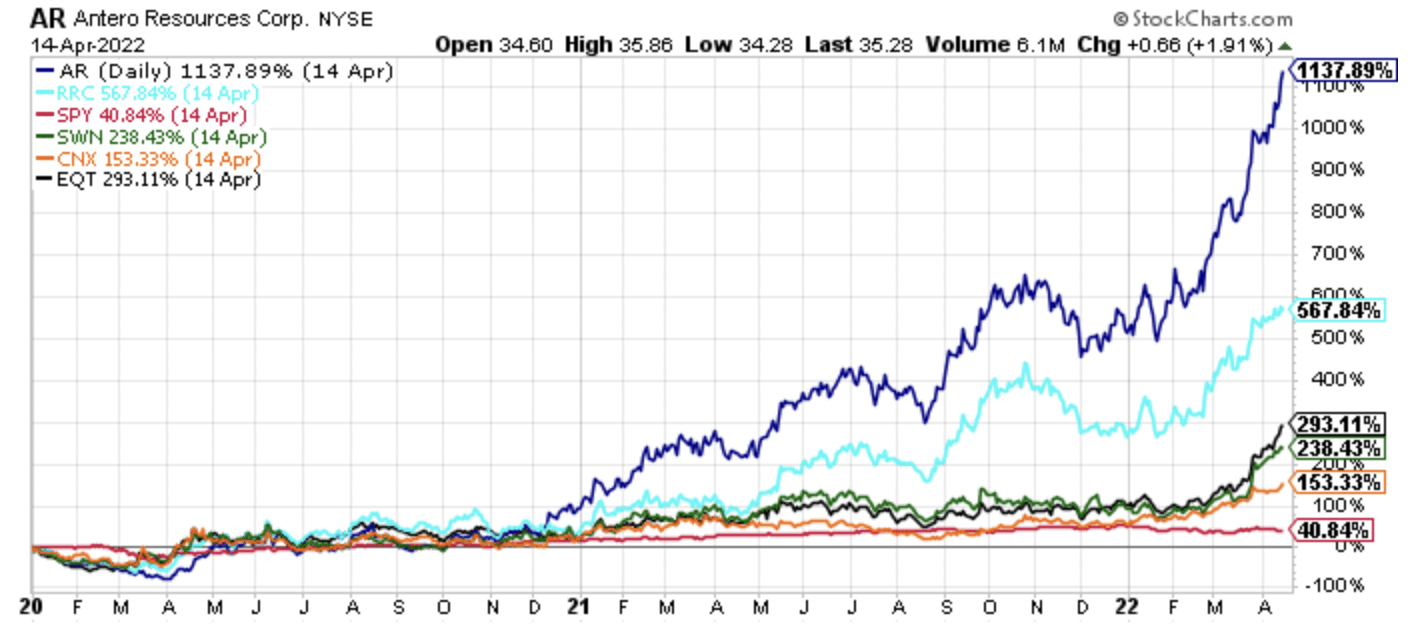
AR RRC EQT SWN CXN SPY Performance Since January 1st, 2020 through April 14th, 2022. (Author, StockCharts)
Antero Resources shares lead the pack, higher by 1137.9% since the start of 2020. For perspective, in the last article in this series published on September 10th, 2021, AR shares were higher by 462.2% from January 1st, 2020 through Thursday, September 9th, 2021. Range Resources is next in line, with a total return of 567.9%, followed by EQT Corp., whose shares have gained 293.1%. Southwestern Energy shares have gained a cumulative 238.4%, and CNX Resources shares have gained 153.3% since the start of January 2020.
Notably, all of these natural gas equities have significantly outperformed the SPDR S&P 500 Index ETF, which has gained 40.8% over this time frame, actually down from the 43.0% in the last update in this series, again published on September 10th, 2021.
Collectively, the “Off To The RACES” stocks have an average return of 478.1% since January 1st of 2020. This is up significantly from the 190.4% average return from the last update, and the 152.6% average return since January 1st of 2020 published in the May 26th, 2021 article.
Looking back to the first article in the series, the average return of 478.1% is up significantly from the average return of 80.4% from January 1st, 2020 through February 2nd, 2021. This might surprise many investors who have cast aside energy equities to the dustbin of history, yet these cast aside energy equities are significantly outperforming.
What are the returns of the FAANG stocks over this time frame?
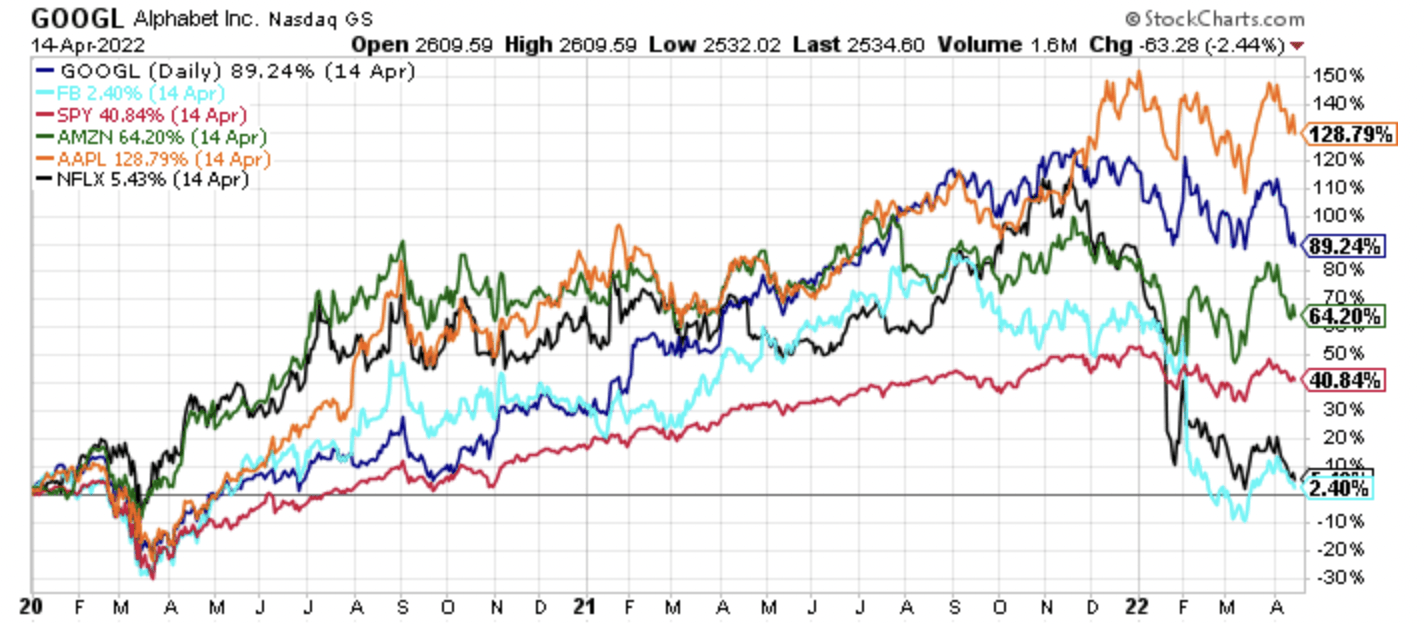
GOOGL FB SPY AMZN AAPL NFLX January 1st 2020 Through April 14th, 2022. (Author, StockCharts)
Like a rotating cast of characters, Apple (AAPL) shares have now jumped into the lead amongst the FAANG quintet, posting a 128.8% gain from January 1st, 2020 through Thursday, April 14th, 2022. The gain for Apple is moderately above the 112.7% gain in Apple shares posted during the September 10th, 2021 update in this series. The problem, however, is that the rest of the FAANG stocks have struggled mightily over this time frame.
Alphabet (GOOGL), (GOOG), shares are now up 89.2% from January 1st, 2020, which is a decline from the 114.3% gain in the last update. Amazon (AMZN) shares now sport a 64.2% gain since January 1st, 2020, down from an 88.6% gain in the last update. Netflix (NFLX) shares have cratered, only posting a 5.4% gain since January 1st, 2020, down from 84.7% gain in the September 10th, 2021 update. Similarly, Facebook (FB) shares have cratered too, only up 2.4% from January 1st, 2020 through April 14th, 2022, which was down from the 84.2% gain in the last update.
The updated returns for the FAANG stocks collectively, are an average return of 58%, which is a major decline from the average return of 96.9% in the September 10th, 2021 update in this series. With this decline, the advantage of the FAANG quintet over the SPDR S&P 500 ETF has shrunk significantly, with SPY up 40.8% from January 1st of 2020.
Providing perspective, the average 58% gain for FAANG stocks not only below the average 96.9% gain in FAANG stocks from the September 10th, 2021 update, it’s also below the 68.5% return posted by the FAANG stocks from the May 26th, 2021 update, which covered January 1st, 2020 through September 9th, 2021 May 25th, 2021. That return was itself up moderately from the first article in this series, with FAANG shares higher by 62.2% on average since January 1st, 2020 through February 2nd, 2021. So, FAANG stocks have effectively declined as a group from their February 2nd, 2021 levels, which is remarkable when you think about the narrative in the markets today. On this note, as I like to say, narrative follows price.
Bottom line, the “Off To The RACES” stocks have delivered an 478.1% average gain since the start of 2020, up from the 190.4% return on average from the last update, significantly ahead of the FAANG average stock return of 58% since January 1st, of 2020. This FAANG 58% average gain is down from the 96.9% average gain from the September 10th, 2021 update. The return gap is widening with each updated article in this series, which is not a surprise given the starting valuation positions of each group of equities circa January 1st, 2020.
Energy Prices Are Surging Led By Natural Gas Prices
Adding to the bullish narrative and relative price performance strength is the fact that natural gas liquids prices and dry natural gas prices are both surging, led by an explosion higher in dry gas prices year-to-date in 2022.
Dry natural gas prices, which can be monitored with the United States Natural Gas Fund (UNG), and the United States 12-Month Natural Gas Fund (UNL), have recently broken through the $7 level (for perspective, they had broken the $5 level in the last update in this series).
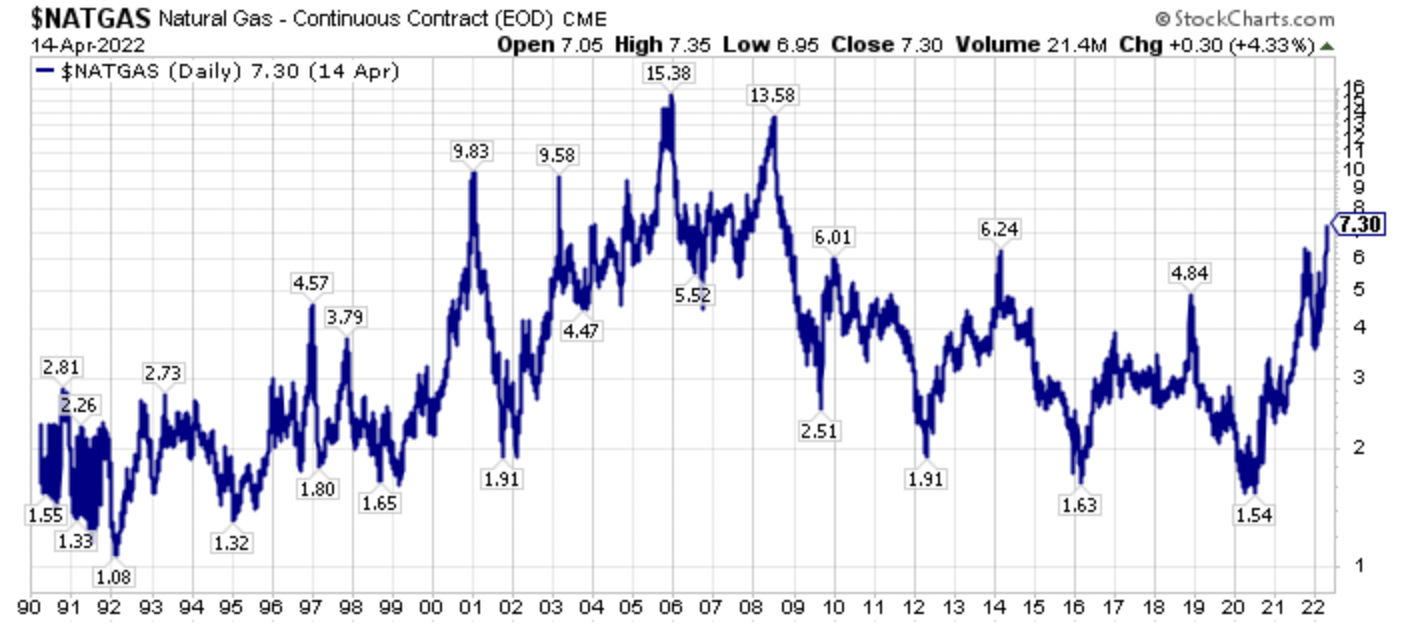
Dry Natural Gas Prices (Author, StockCharts)
The breakout in dry gas prices has seen both UNG and UNL make new multi-year highs.
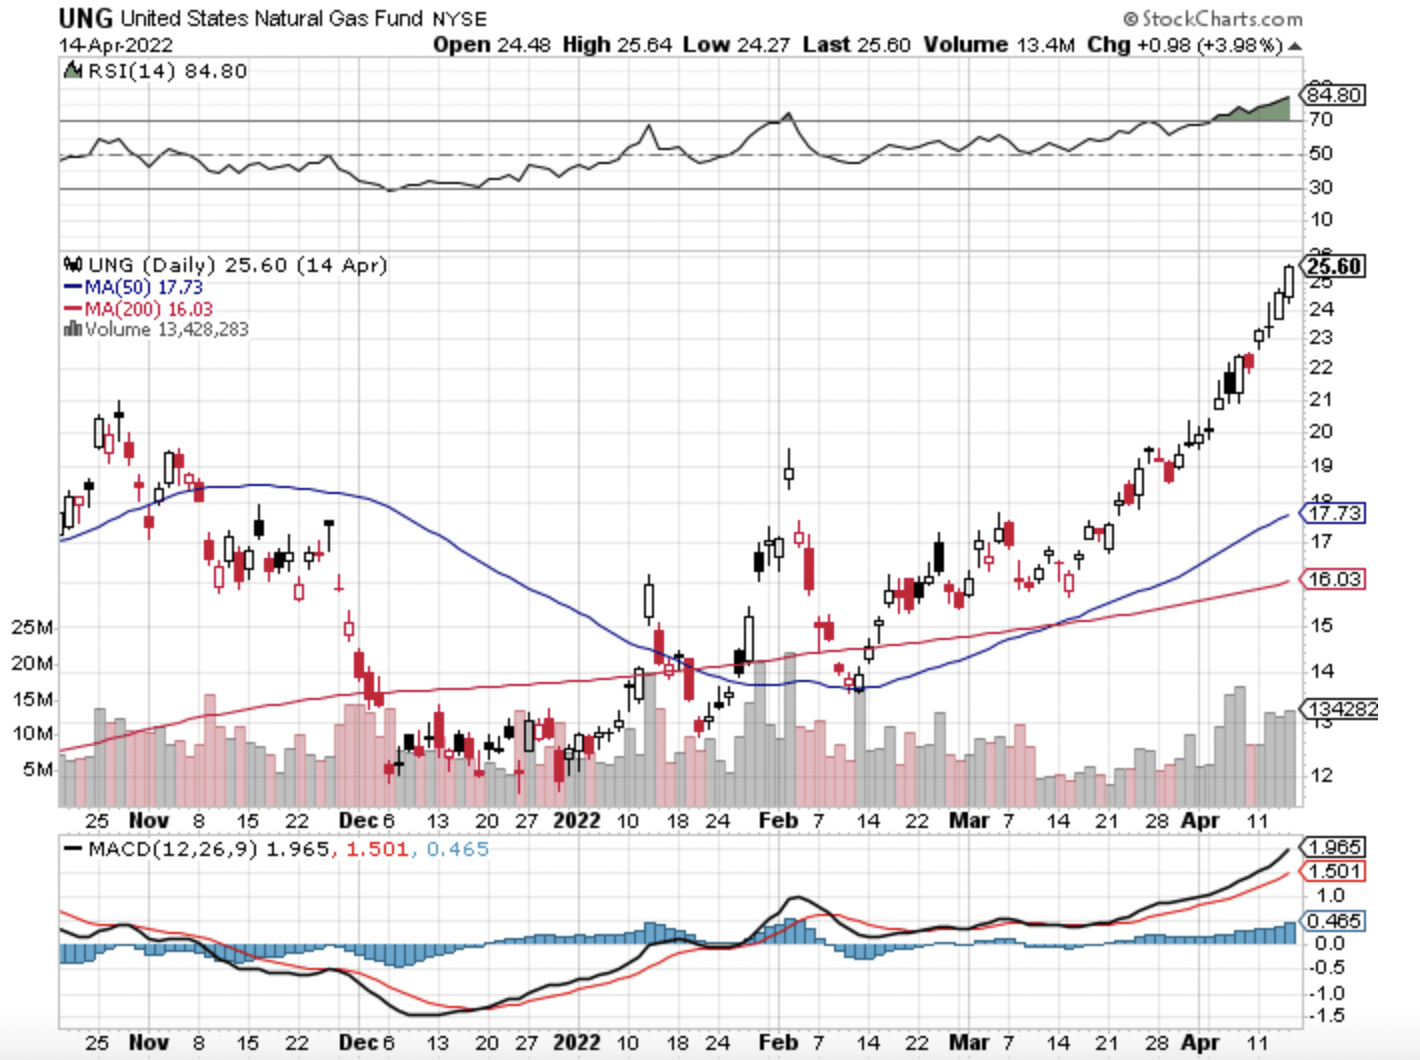
UNG Daily (Author, StockCharts)
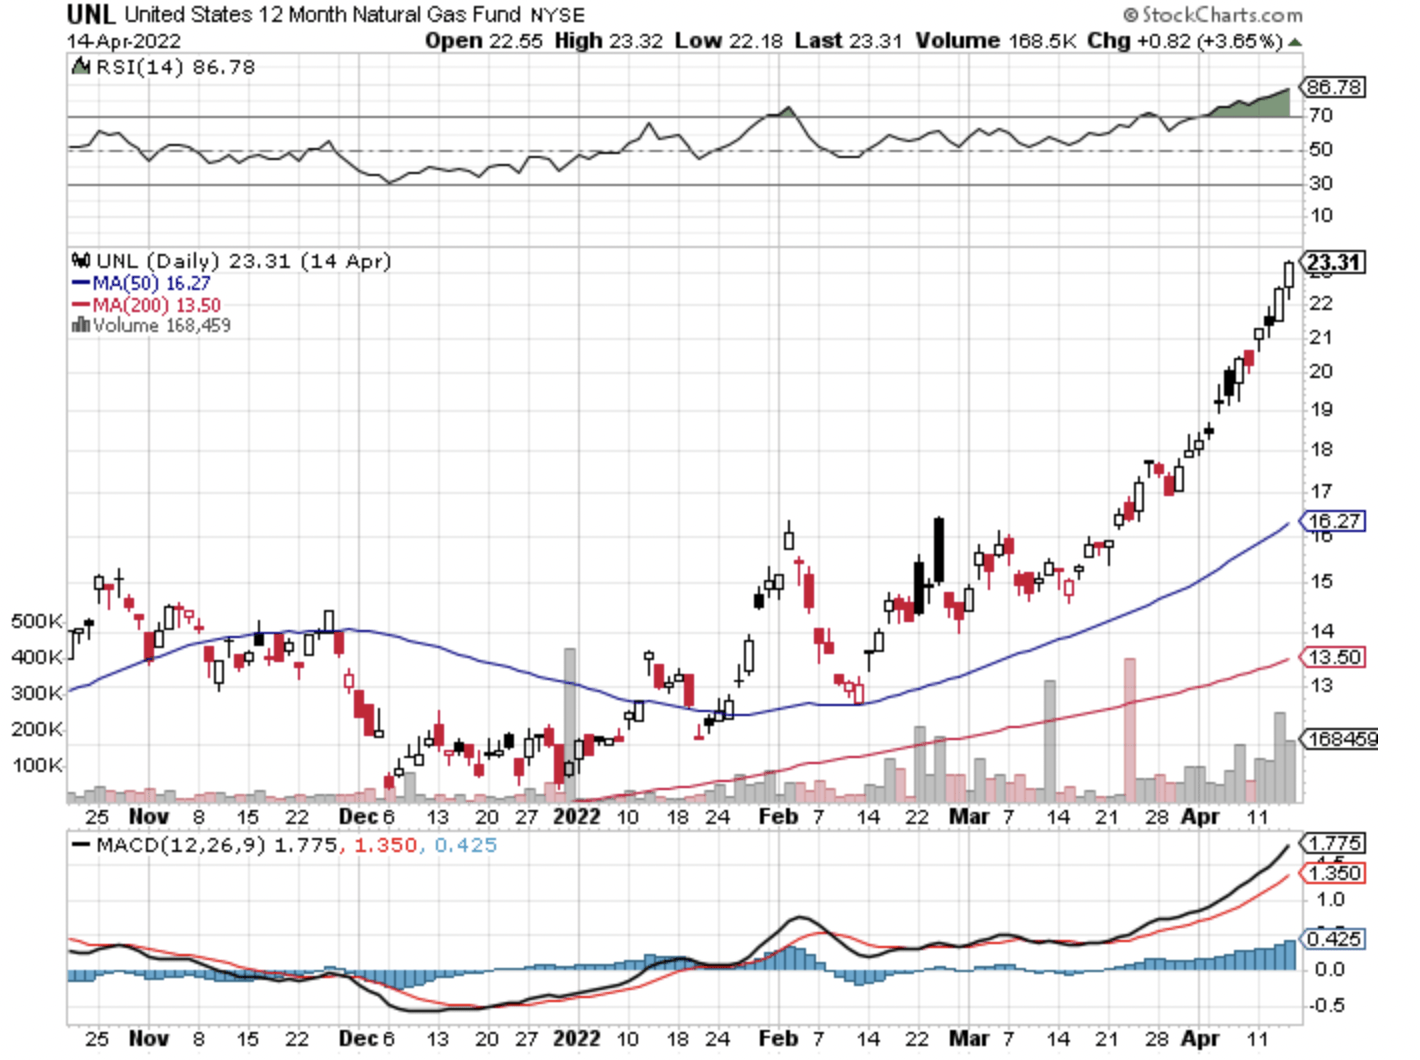
UNL Daily (Author, StockCharts)
For perspective, in the September 10th, 2021 update in this series, UNG was priced at $17.49, and today it is at $25.60. Meanwhile,…
Read More:Off To The RACES: Natural Gas Equities Extend Their Lead Versus FAANG Stocks
2022-04-15 22:07:00