
eyegelb/iStock via Getty Images
The Q4 and FY2021 Earnings Season for the Gold Miners Index (GDX) has finally begun, and one of the most recent companies to report its results is Gold Fields (GFI). Despite a difficult start to the year at Cerro Corona and continued COVID-19 headwinds, GFI put together a solid year, reporting 5% production growth. While costs were higher and will increase further in 2022, 2022/2023 should mark peak costs over the next few years, with Salares Norte’s contribution helping to pull down costs in 2024. However, with Gold Fields trading at ~13x FY2022 earnings estimates at $13.25, I don’t see any margin of safety to justify starting new positions.
Gold Fields Operations (Company Website)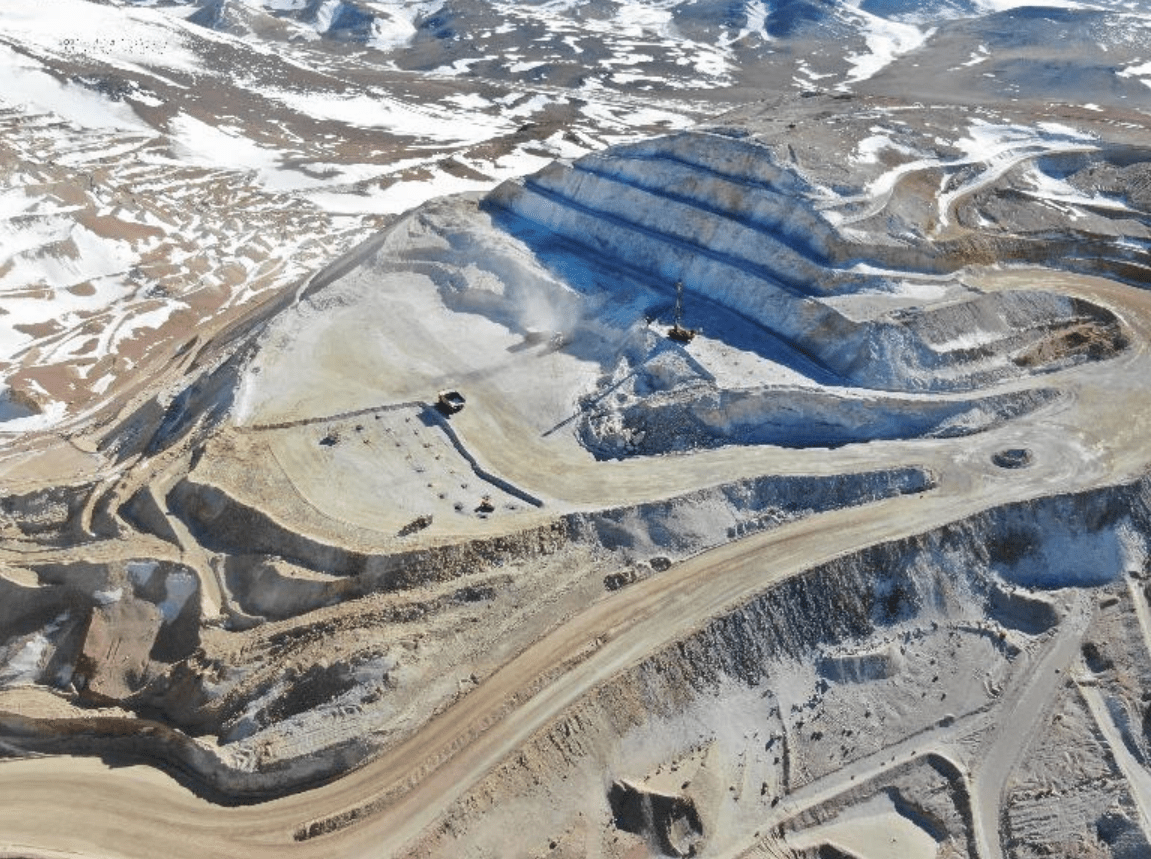
Gold Fields released its Q4 and FY2021 results last week, reporting quarterly production of ~650,000 ounces, helping the company to produce ~2.34 million ounces for the year. This translated to 5% production growth vs. the ~2.24 million ounces produced in 2020, helped by a better year from Cerro Corona and a great year from the higher-cost South Deep Mine in South Africa. The only negative was that costs were up sharply on a year-over-year basis to $1,063/oz, but they came in just below the industry average, which I have estimated to be ~$1,080/oz. Let’s take a closer look at the results below:
Gold Fields – Quarterly Production by Mine + Salares Norte Estimates (2024) (Company Filings, Author’s Chart & Estimates)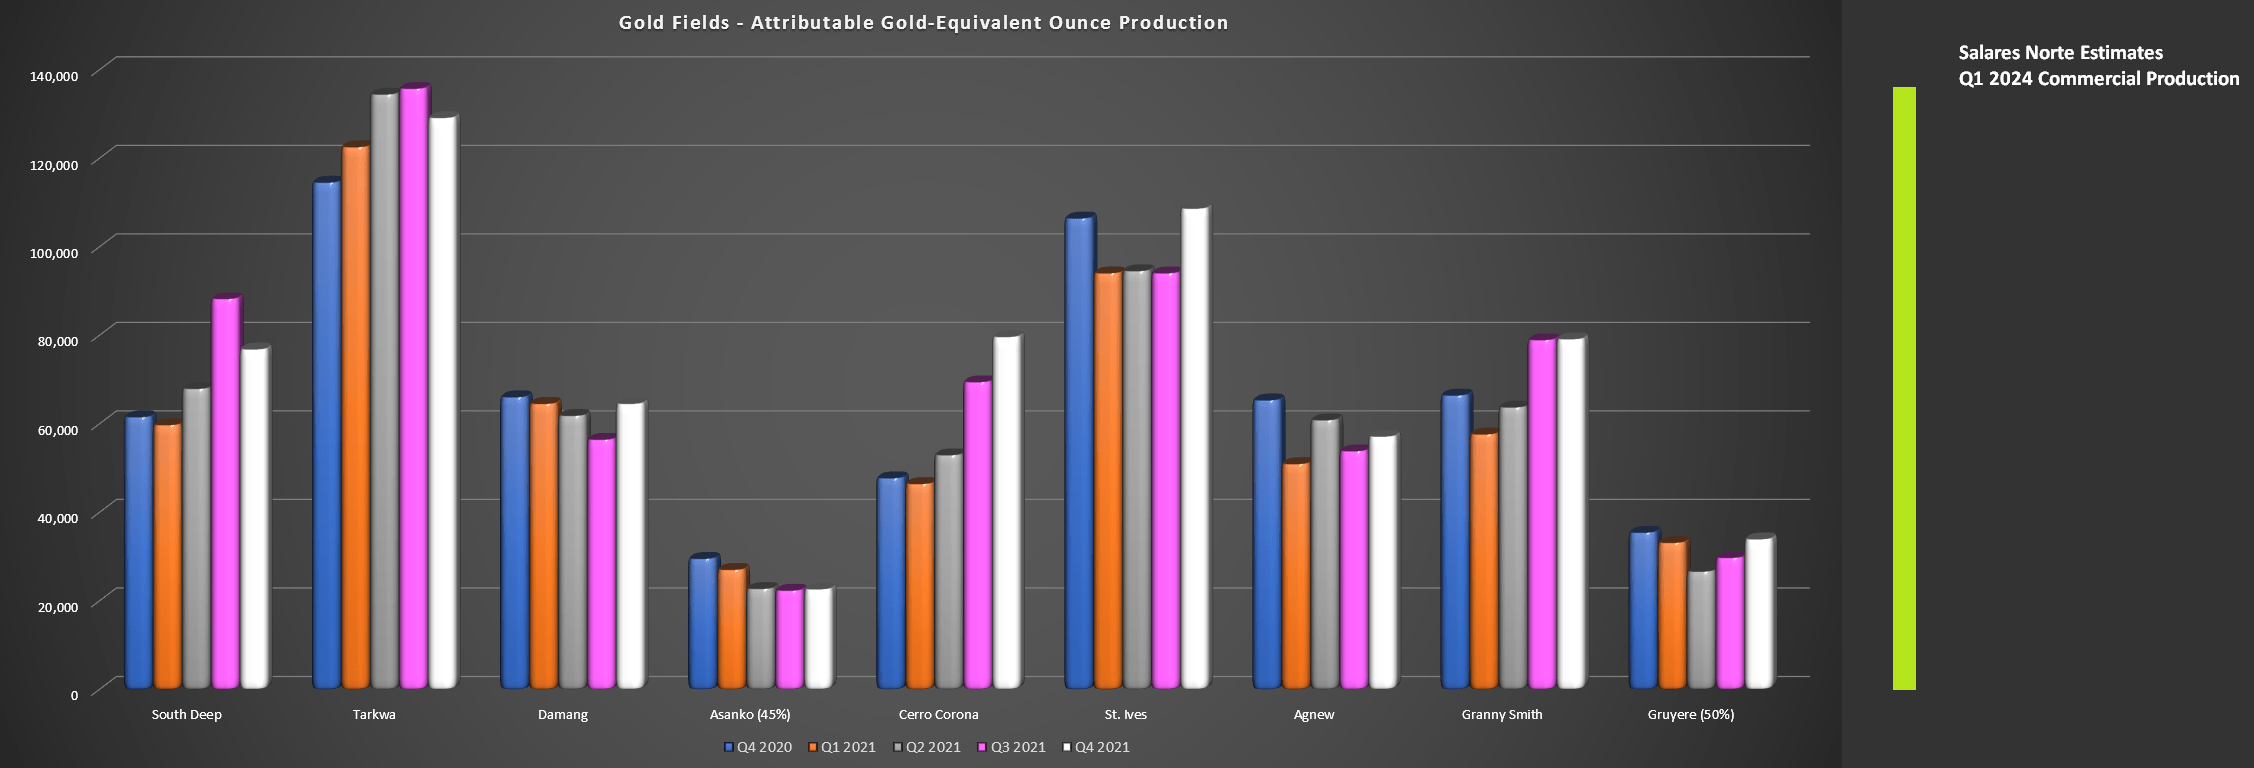
As shown in the chart above, Gold Fields had a solid finish to the year, and a strong year overall, with increased production from South Deep, Cerro Corona, St Ives, and Tarkwa on a year-over-year basis in Q4. At South Deep, the strong results were driven by improved productivity, with gold produced per employee on an annual basis continuing to trend higher. Key operating metrics at the mine have continued to trend in the right direction, leading to a more than 180% increase in free cash flow generation on a year-over-year basis.
South Deep Key Operating Metrics (Company Presentation)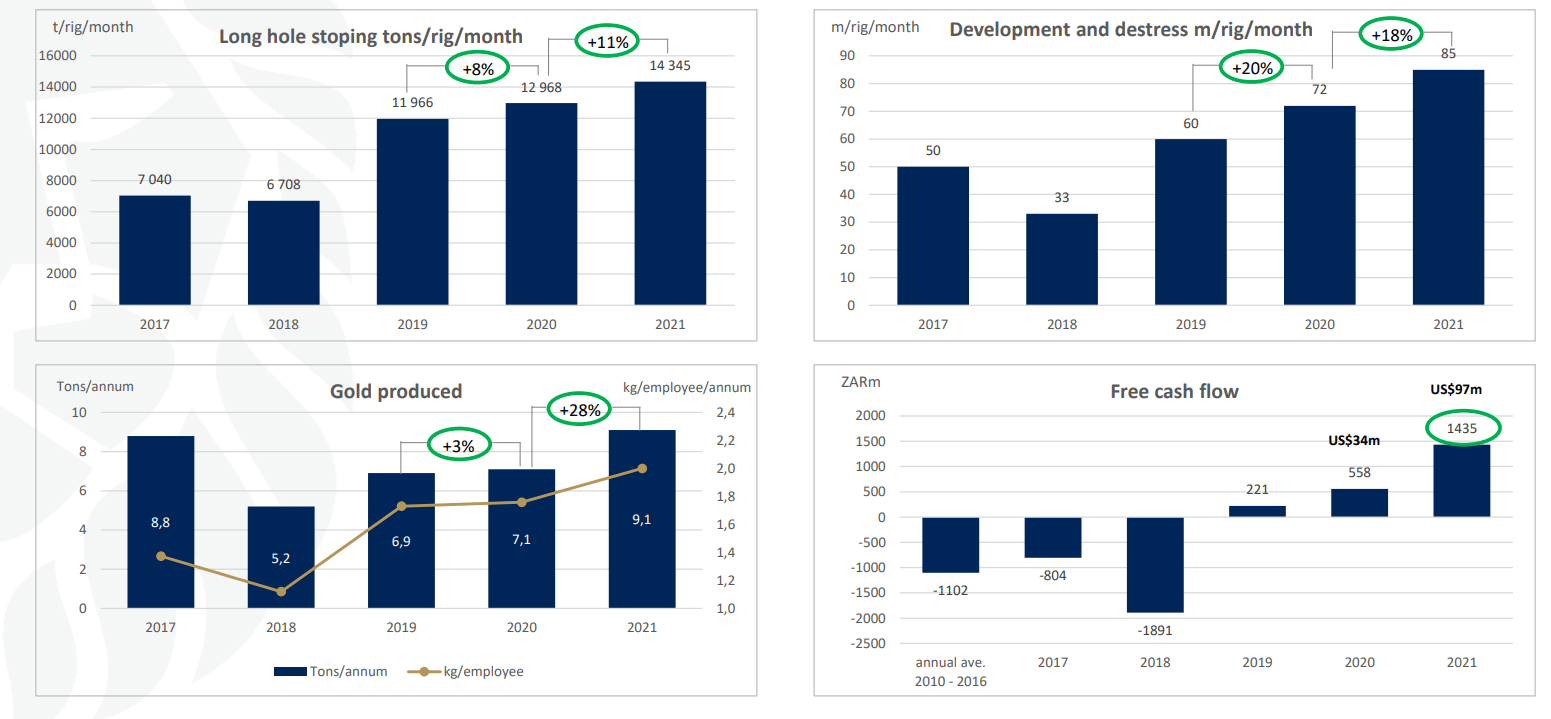
According to recent guidance, the company believes that South Deep has meaningful growth on the horizon, with the possibility that production could grow from ~293,000 ounces in FY2021 to ~365,000 ounces in FY2025. This would translate to ~65% growth relative to FY2019 levels, which will help to offset declining production from Damang in the same period. Overall, South Africa had a great period, even if it’s a small contributor to the group production, with output up 29% year-over-year and well above original guidance, even if costs were above the group average ($1,310/oz).
Moving to Australia, the company’s St Ives and Granny Smith operations had solid quarters, with combined production of nearly 188,000 ounces, up from ~173,0000 ounces in Q4 2020. However, with a lower contribution from Agnew on a full-year basis (~223,000 ounces vs. ~233,300 ounces), production was flat year-over-year in Australia. Meanwhile, costs were up sharply to $1,065/oz from $917/oz, partially related to labor inflation, higher sustaining capital at all three operations, and a stronger Australian Dollar.
Australian Dollar/US Dollar 2020 vs. 2021 (TC2000.com)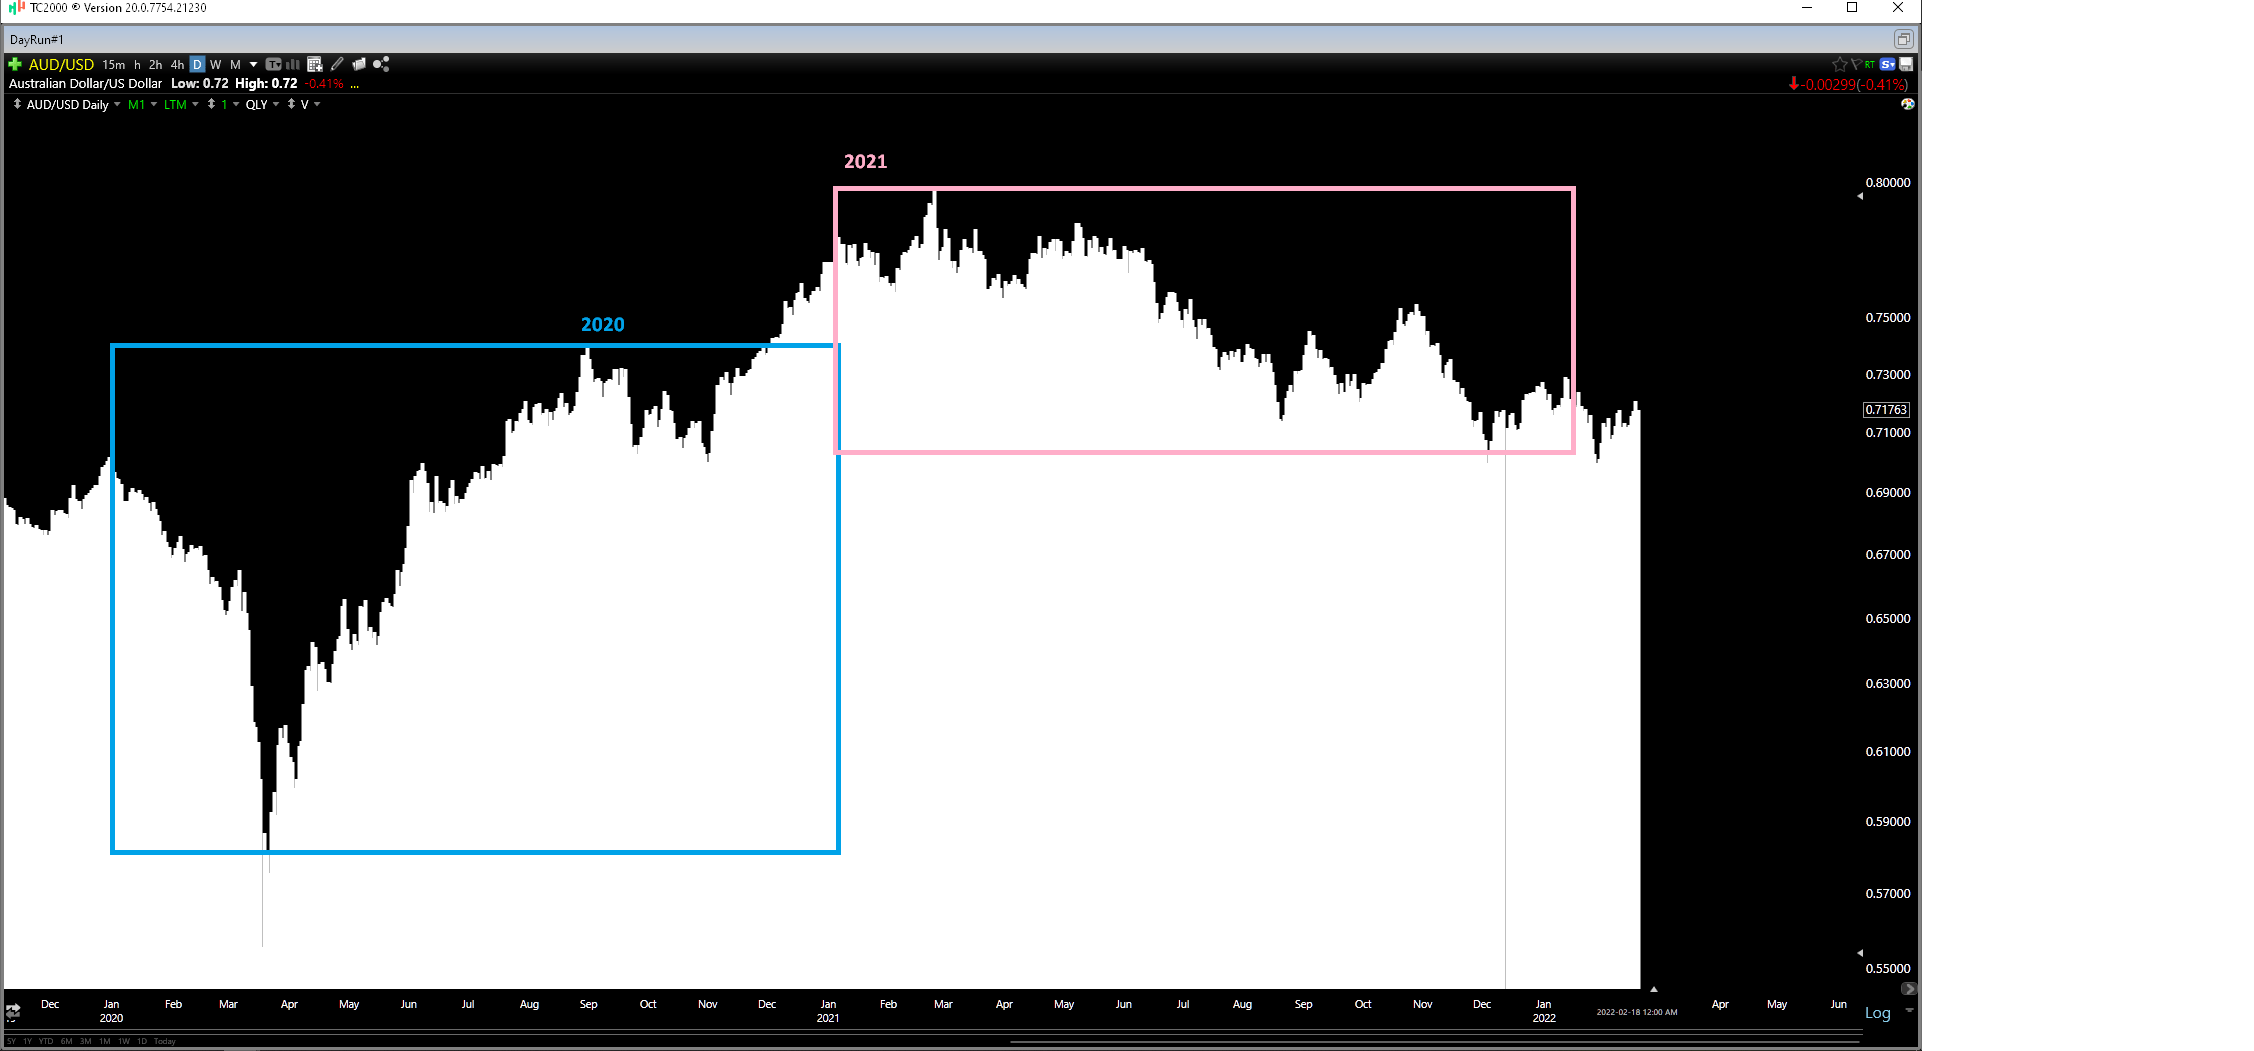
Fortunately, after a difficult 2020 due to COVID-19 headwinds, Cerro Corona had a satisfactory year from a production standpoint, though this was mostly related to the higher copper price. While gold production was down 5% and copper production was up 4%, impacted by the slope failure in H1, which led to resequencing of the mine plan, GEO production increased 20%, and costs fell 7% to $920/oz. This was a welcome development after a year of higher costs, and Gold Fields is guiding for a solid year in 2022, with slightly higher GEO production (~255,000 vs. ~248,000) at slightly lower costs.
On the development front, Salares Norte construction was impacted by indirect effects of COVID-19, with workforce availability lower than expected. However, the project progressed by 12.3% in Q4, and completion sits at more than 60% as of year-end. Notably, pre-stripping of the Brecha Principal pit is ahead of schedule with over 10 million tonnes moved in the quarter, and 23 million tonnes were moved in total, up from 17 million tonnes planned. The only negative is that the chinchilla relocation process has proven more difficult than planned, with a delay in relocation.
Salares Norte Construction (Company Presentation)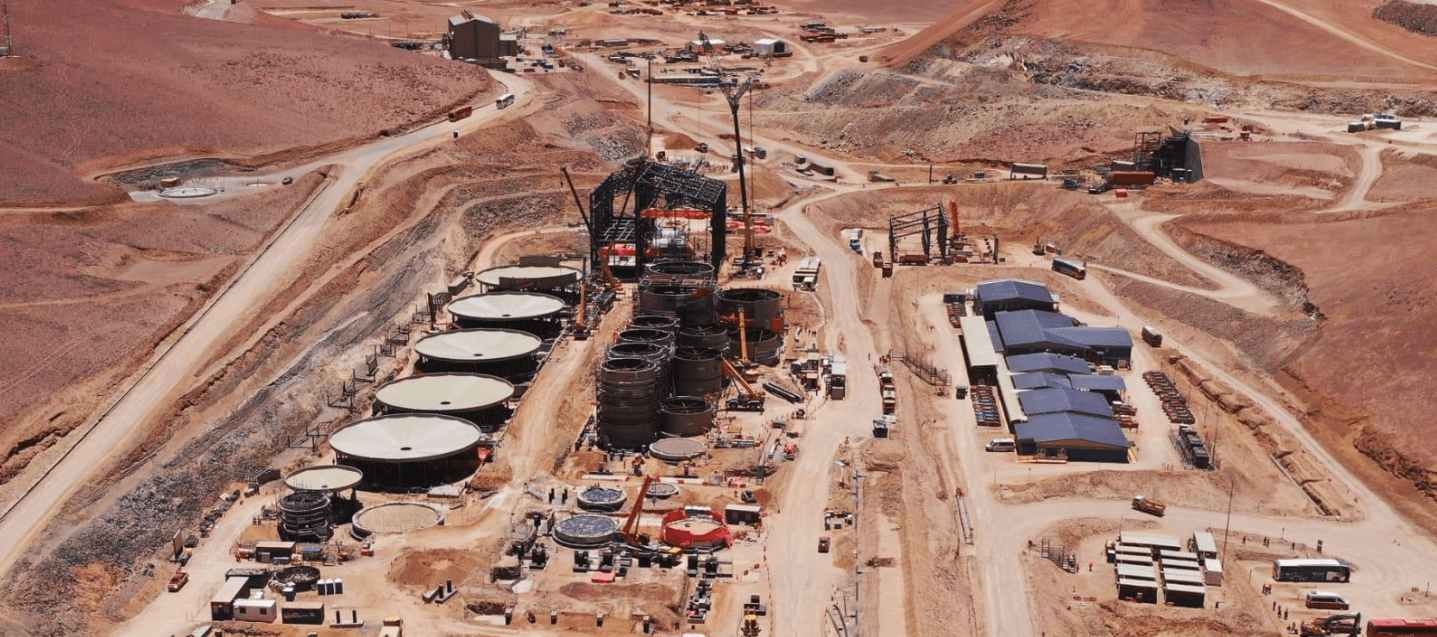
The good news is that this does not affect the current construction or early production. However, the relocation process will need to be solved by 2025 to allow for pre-stripping at Agua Amarga to allow for production in 2028 from this deposit in 2028. Assuming this issue is solved without any issue, Salares Norte is a game-changer for Gold Fields, with the production of 500,000+ GEOs per annum at sub $700/oz costs. In addition to the incremental growth to help offset lower production at Damang that begins next year, it further diversifies its operations.
2022 Guidance & Forward Estimates
Inflationary pressures are taking a toll on all producers, and given the increases in fuel, consumables, labor, and materials costs, it’s no surprise that Gold Fields is also guiding for higher costs in FY2022. Based on the current outlook, Gold Fields expects to increase production to ~2.27 million ounces year-over-year (ex-Asanko), or ~2.37 million ounces with the Asanko contribution. However, despite the low-single-digit production growth, costs are expected to rise to $1,160/oz at the midpoint from $1,063/oz in FY2021.
The good news is that with the gold price finally catching a bid, this may not be a big deal for margins, with a higher gold price helping to offset some of the cost increase. Besides, as the chart below shows, while costs will rise for the third consecutive year in 2022, costs should peak in early 2023 once Salares Norte comes online. Based on my more conservative estimates of ~$675/oz all-in sustaining costs, costs could decline in 2023 from 2022 levels before dipping closer to $1,050/oz in FY2024.
Gold Fields – Estimated Production & Cost Outlook (Author’s Chart & Estimates)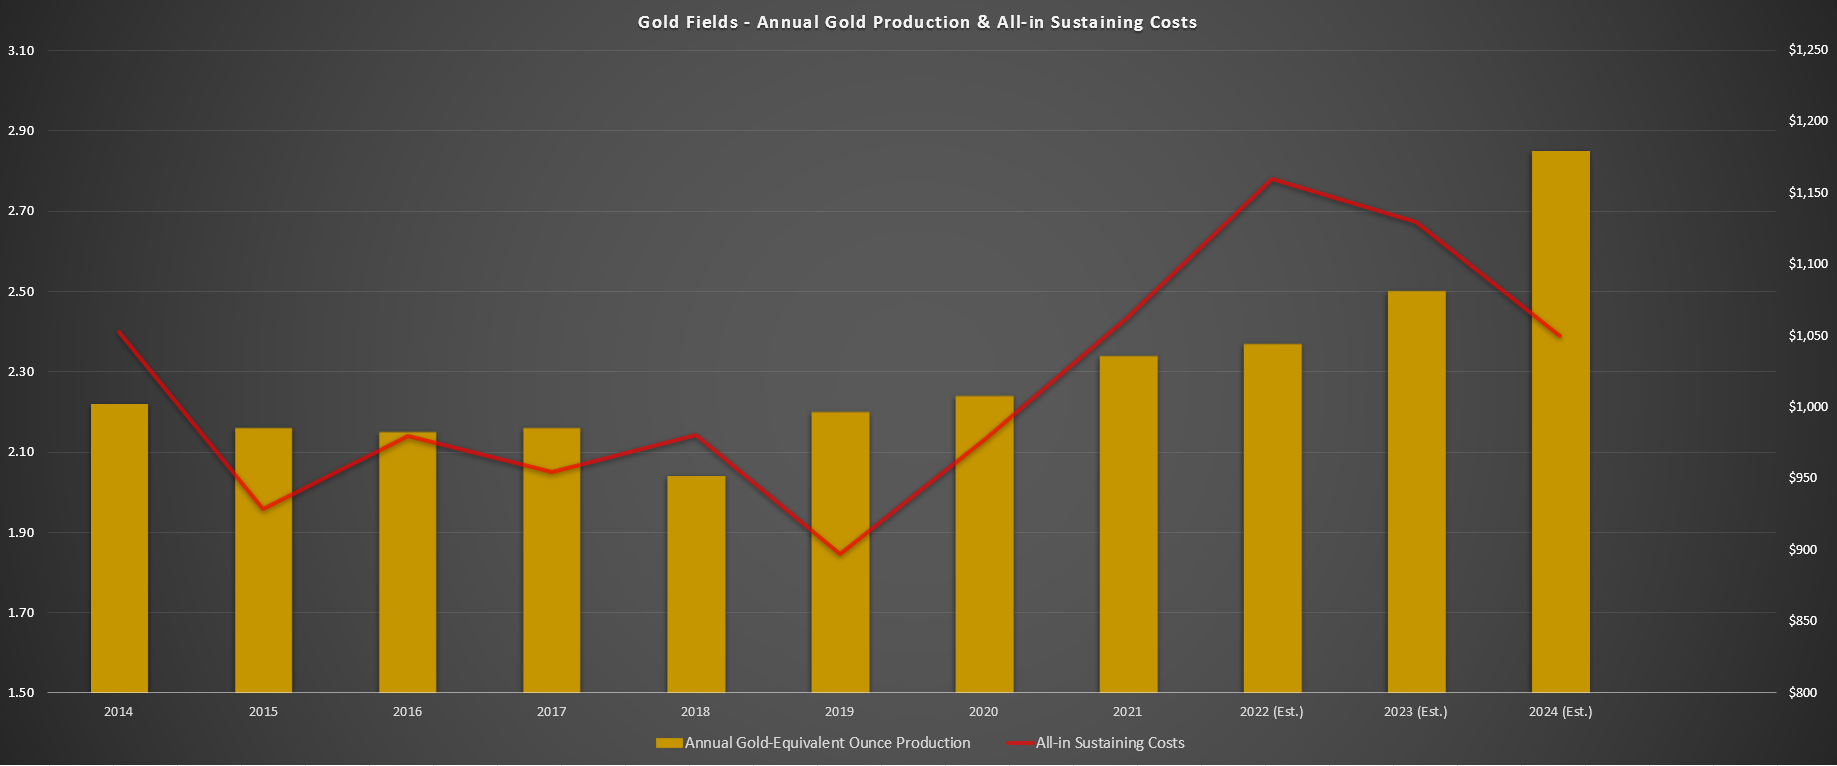
So, while most producers will see higher cost profiles from 2021 to 2024, Gold Fields is one of the few companies that should be able to buck this trend, assuming no hiccups at Salares Norte and inflationary pressures don’t worsen. This differentiates Gold Fields from its peers and also places the company on track to grow annual earnings per share by nearly 30%, looking out to FY2024, even if we don’t see much help from the gold price. As shown below, Gold Fields managed to increase annual EPS slightly by more than 15% on a year-over-year basis ($1.00 vs. $0.83), and we could see a slight increase in EPS this year, as long as the gold price can average $1,850/oz or higher.
GFI Earnings Trend (FactSet, Author’s Chart)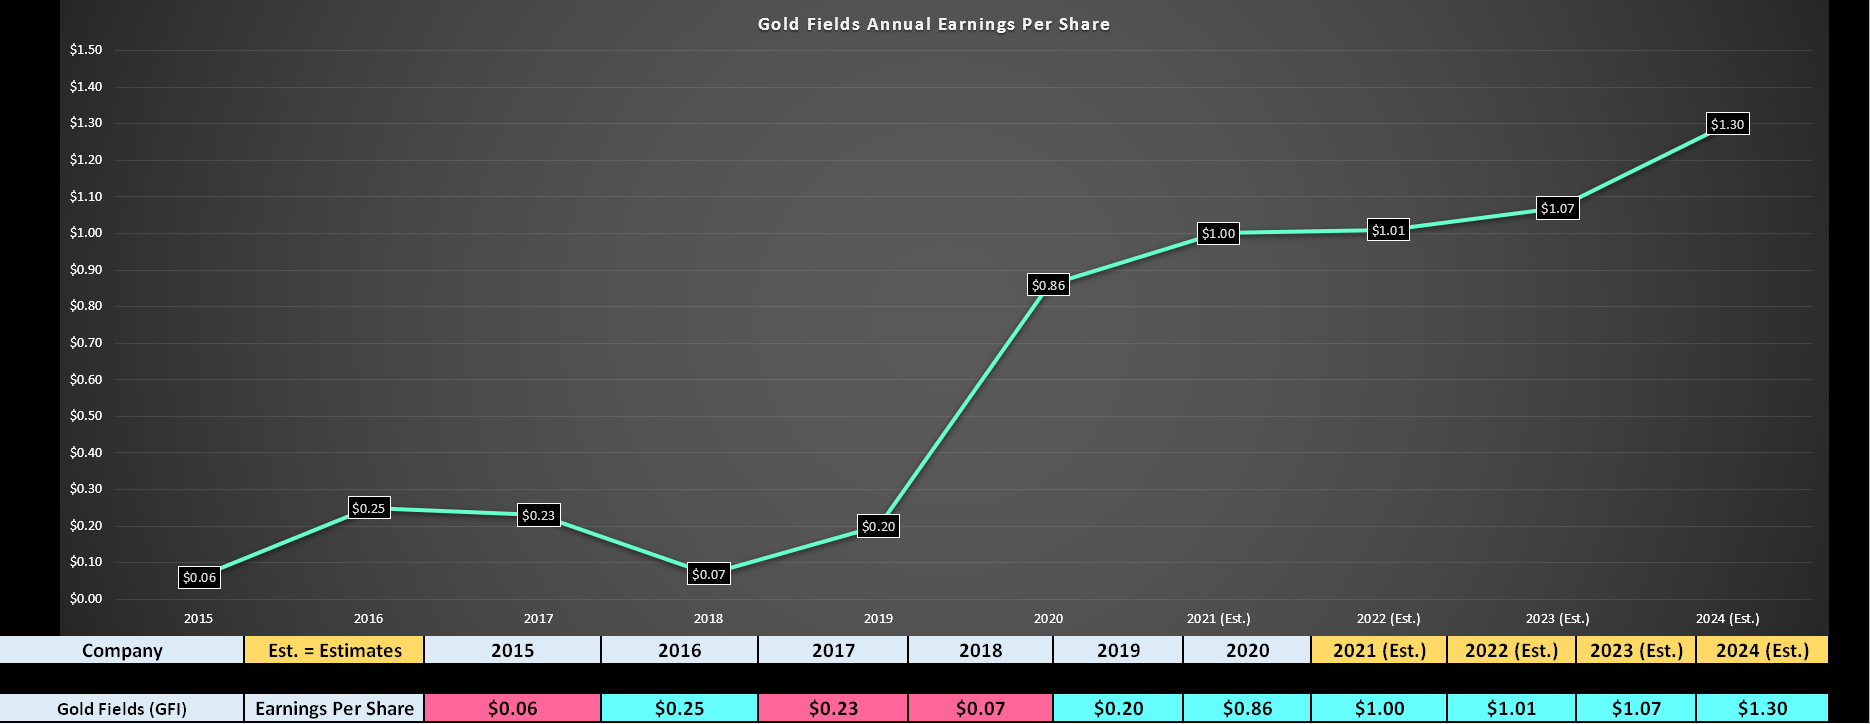
Valuation & Technical Picture
Following the sharp rally in Gold Fields and its massive outperformance vs. its peer group, Gold Fields now trades at a market cap of nearly $12 billion based on a share price of $13.25 and ~885 million shares outstanding. This places the company well ahead of companies like Kinross (KGC) and AngloGold Ashanti (AU), which have similar production profiles. Obviously, the premium multiple vs. AngloGold can be attributed to GFI’s higher margins. In contrast, the premium vs. Kinross can be attributed to Gold Fields being a more steady earnings grower, while Kinross is expected to see FY2022 annual EPS below FY2020 levels ($0.63 vs. $0.77).
Based on what I believe to be a conservative earnings multiple for Gold Fields of 13.5 and FY2022 annual EPS estimates of $1.07, I see a fair value for the stock of $14.45. This lower earnings multiple relative to companies like Newmont (NEM) is based on Gold Fields having a smaller production profile, less exposure to Tier-1 jurisdictions, and some exposure to a Tier-3 jurisdiction (South Africa). So, with GFI trading within 10% of my conservative fair value ($14.45), I don’t see a ton of value at current levels.
Gold Fields Operating Cash Flow Multiple (FASTGraphs.com)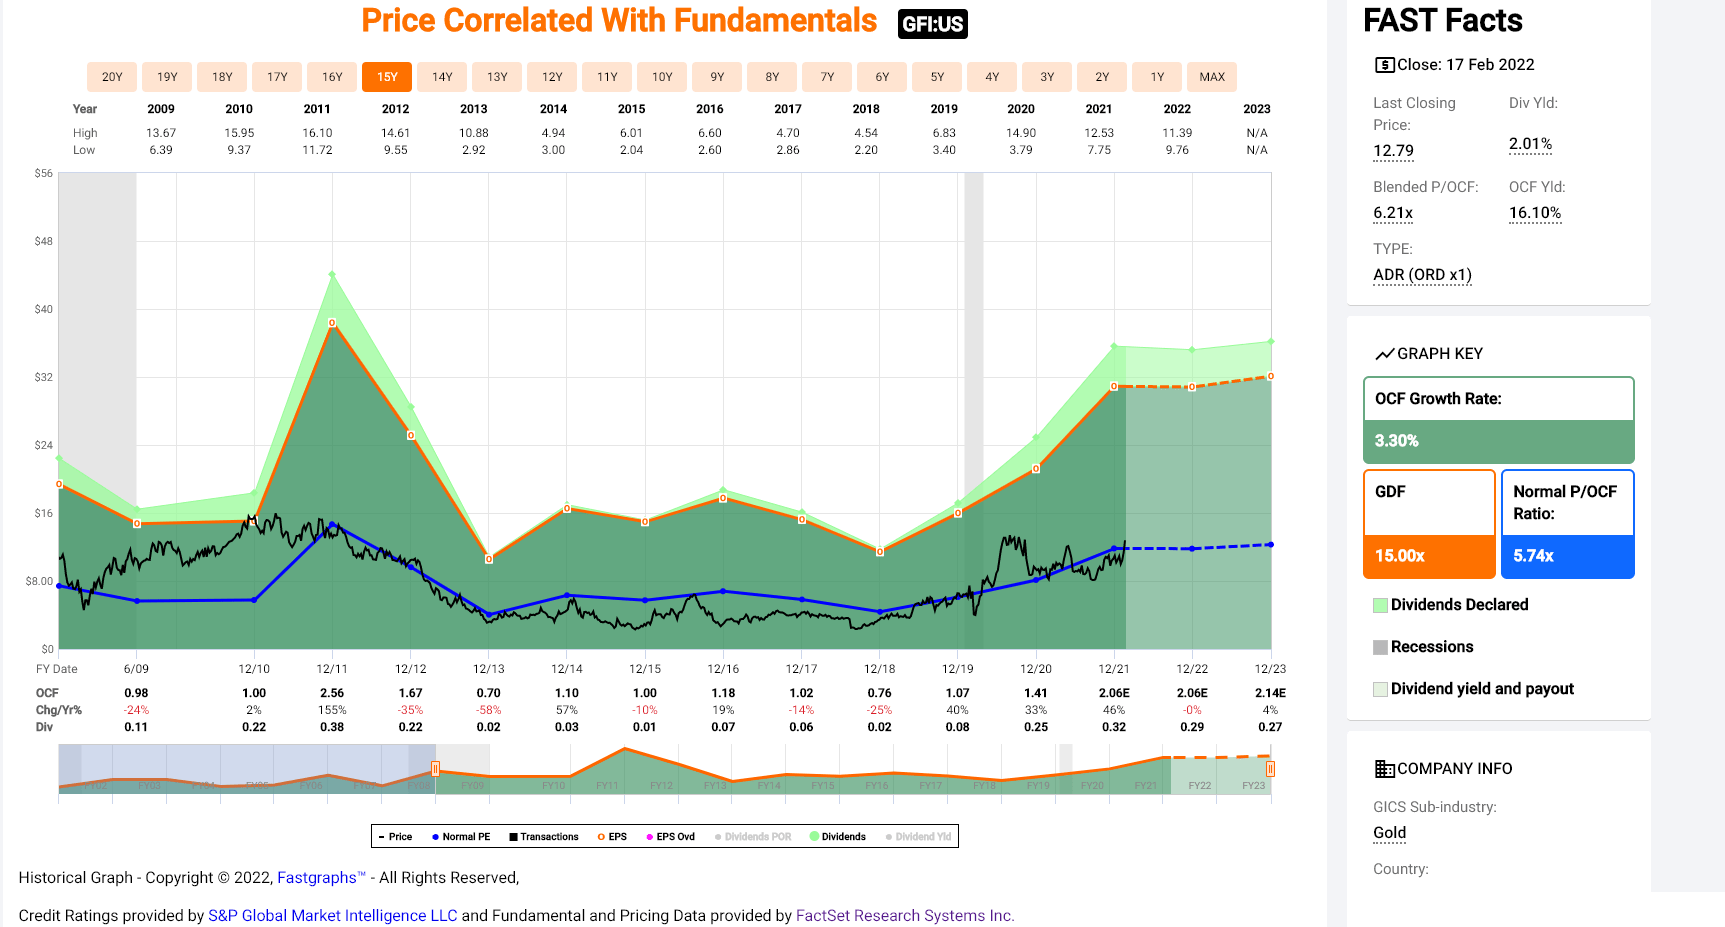
This is confirmed by the stock trading at a slight premium to its historic cash flow multiple as of Friday’s close. As shown above, GFI has historically traded at closer to ~6x cash flow, and at a share price of $13.25, it is trading at ~6.3x FY2022 cash flow estimates. This doesn’t mean that the stock can’t go higher, but as we can see in the above chart, the best time to buy the stock has been when it’s traded at a significant discount to this level, not a premium. The last time it traded at a large discount to this multiple was in Q2 2021, when I noted that it was a compelling buy below $9.20.
Elsewhere in the sector, among more beaten-up names, I see a few producers with an upside of more than 50%, given that they remain out of favor and are sitting closer to their Q2 2020 lows. Therefore, on a relative basis, it’s hard to argue for being overweight Gold Fields here, even if one is bullish on the margin improvements, and ~20% growth coming from the Salares Norte Mine in 2024 and onwards. Let’s see whether the technical picture confirms that the reward/risk ratio is unfavorable here:
GFI Daily Chart (TC2000.com)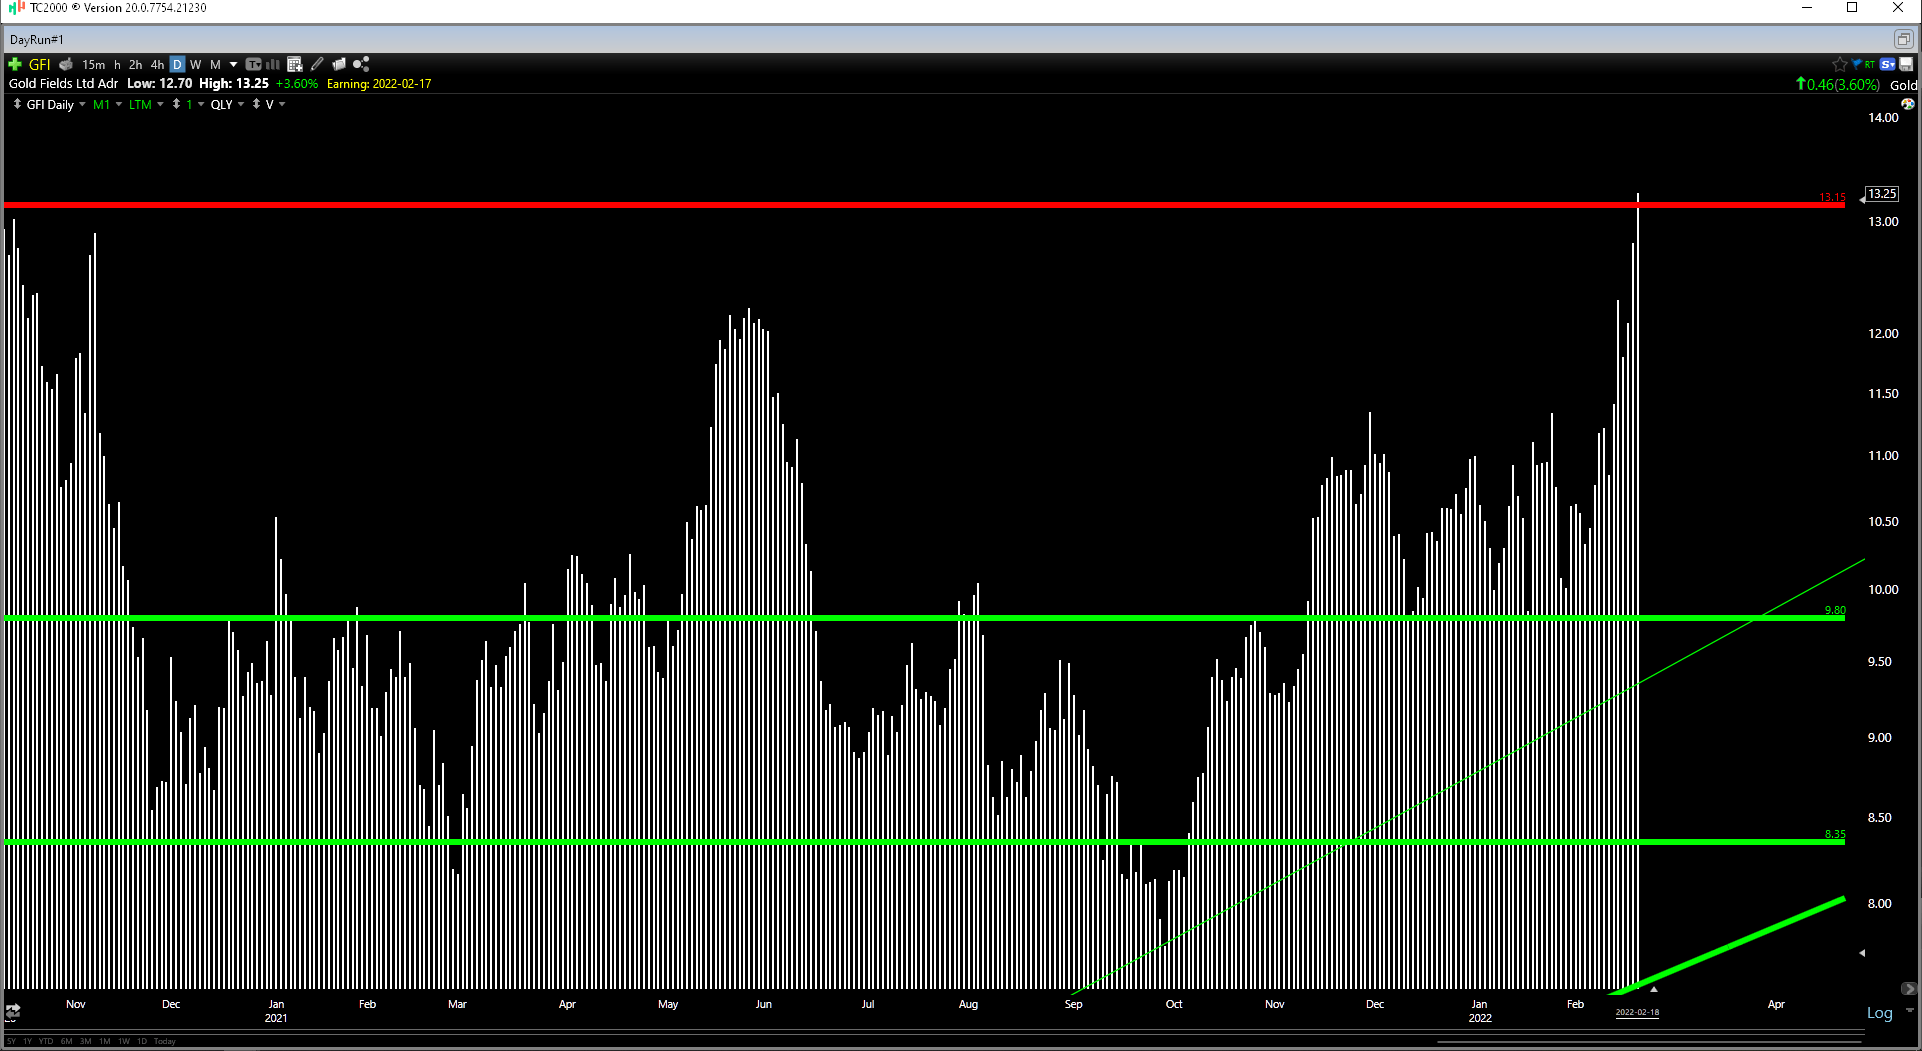
Looking at the technical picture above, we can see that GFI has enjoyed an impressive rally since October, with the stock massively outperforming the Gold Miners Index, up ~70% vs. the GDX’s ~21% return. Given this outperformance, it’s no surprise that the stock offers less value than some of its peers on a comparative basis, even if the stock is still not overvalued itself. Notably, GFI has traded up to a key resistance in the $13.15 – $13.45 zone and has no strong support until $9.80. This translates to a reward/risk ratio of less than 0.10 to 1.0, which is unfavorable for investors looking to start new positions.
The reward/risk ratio is based on GFI having $0.20 in upside to the top end of its resistance zone ($13.45) and $3.45 in…
Read More:Gold Fields: A Solid Year Despite Challenges (NYSE:GFI)
2022-02-20 06:18:00