
US Dollar Technical Price Outlook: DXY Weekly Trade Levels
- US Dollartechnical trade level update – Weekly Chart
- USD recovery stalls into yearly open – FOMC takes center stage next week
- DXY support 95.15, 94.47(bullish invalidation) – Key resistance 96.50/67, 97.70
The US Dollar Index rallied 0.46% this week with the DXY trading at 95.60 ahead of the US close on Friday. The advance keeps the index within the January range and the focus now shifts to the Federal Reserve interest rated decision next week to offer guidance with the broader 2021 rally hanging in the balance. These are the updated technical targets and invalidation levels that matter on the US Dollar Index weekly price chart. Review my latest Strategy Webinar for an in-depth breakdown of thisDXY technical setup and more.
US Dollar Index Price Chart – DXY Weekly
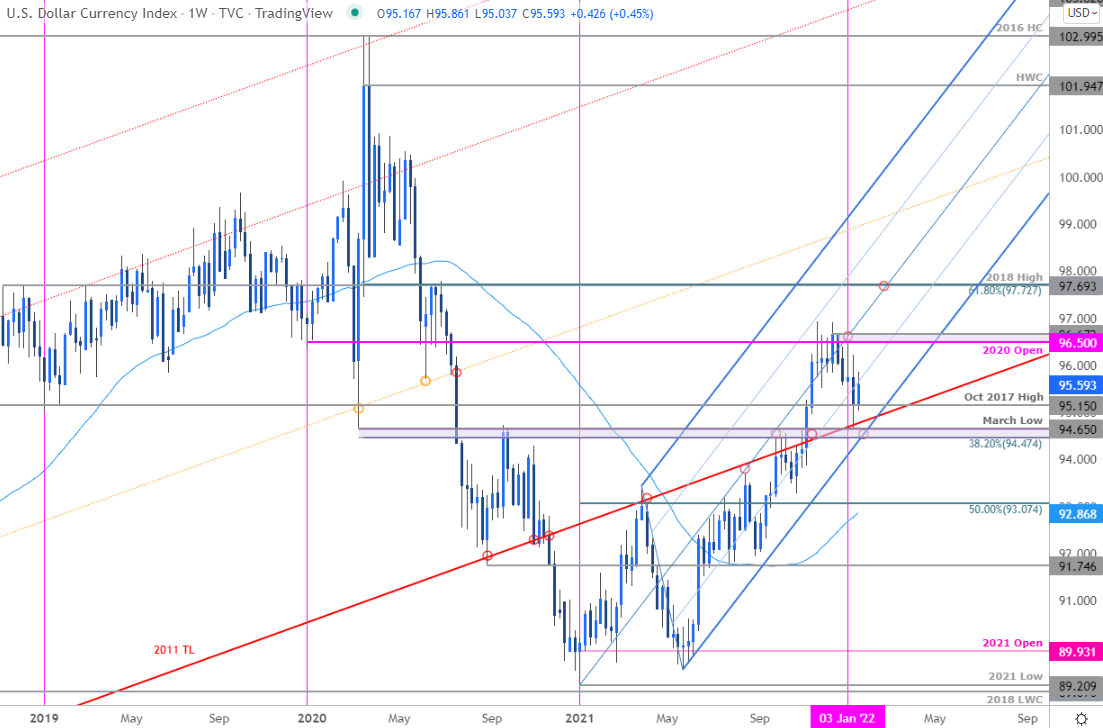
Chart Prepared by Michael Boutros, Technical Strategist; US Dollar Index on Tradingview
Notes: In my last US Dollar Weekly Price Outlook we noted that, “The US Dollar rally has stalled into a major resistance zone at 96.50/67. From a trading standpoint, a good region to reduce long-exposure / raise protective stops. Losses should be limited to 94.47 IF price is indeed heading higher…” DXY registered a low at 94.62 on January 14th before reversing sharply with the index poised to close the week just below the yearly open at 95.67. The stage is set for the Fed.
Look for resistance along the upper parallel (blue downslope currently around ~96) with critical resistance steady at 2020 yearly open / 2021 weekly high-close at 96.50/67 – a breach / weekly close above this threshold is needed to validate a larger breakout in the greenback with such a scenario exposing the 2018 swing high / 61.8% Fibonacci retracement of the 2020 decline at 97.69/72.
Initial supportremains with the October 2017 high at 95.15 with bullish at 38.2% retracement of the 2020 decline / March 2020 low at 94.47/65– losses below this threshold would mark a break of the 2021 uptrend and could fuel an accelerated decline for the dollar.
For a complete breakdown of Michael’s trading strategy, review his Foundations of Technical Analysis series on Building a Trading Strategy
Bottom line:The battle lines are drawn for the US Dollar heading into Fed week and the focus is on a breakout of the monthly range for guidance with the broader outlook constructive while above 94.47. From at trading standpoint, be on the lookout for possible downside exhaustion next week with the FOMC rate decision likely to fuel the directional break. I’ll publish and updated US Dollar Price Outlook once we get further clarity on the near-term DXY technical trade levels.
Key US Data Releases
![]()
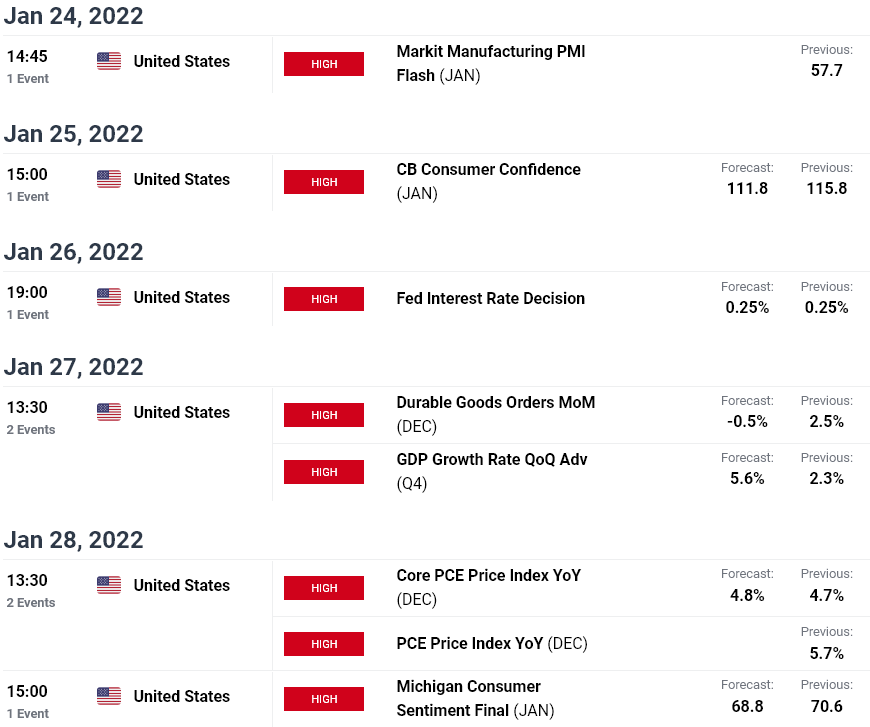
Economic Calendar – latest economic developments and upcoming event risk.
Previous Weekly Technical Charts
— Written by Michael Boutros, Technical Strategist with DailyFX
Follow Michael on Twitter @MBForex
Read More:Do or Die for DXY Trend – FOMC on Tap
2022-01-23 09:00:00