
This post was originally publihed onn TKer.co
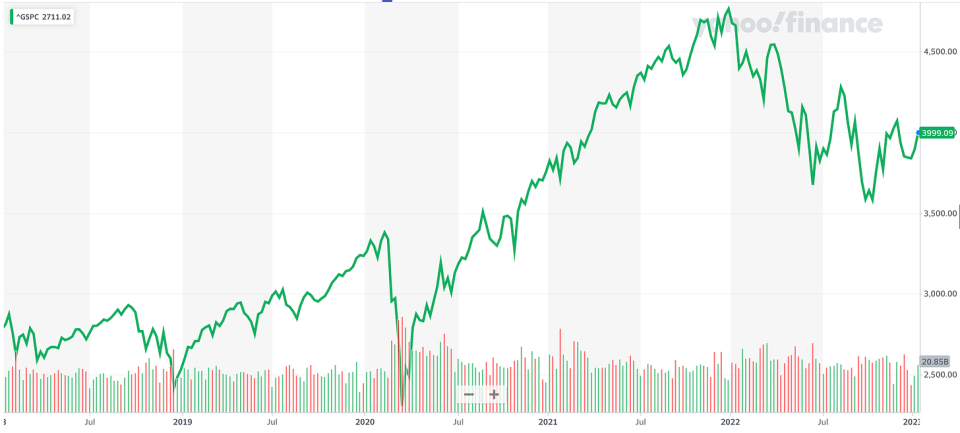
Stocks rallied again, with the S&P 500 climbing 2.7% last week. The index is now up 11.8% from its October 12 closing low of 3,577.03 and down 16.6% from its January 3, 2022 closing high of 4,796.56.
The past two weeks have come with loads of new data, and a lot of analysts returning from break published tons of fresh research.
Here are a few charts about the market that stood out:
Financial obligations have been manageable
“To date, higher interest rates have not negatively impacted margins,” Jonathan Golub, chief U.S. equity strategist at Credit Suisse, wrote in a January 4 note to clients.
To illustrate this, Golub share this chart of S&P 500 interest expenses as percentage of revenue.

For more on the implications of higher interest rates, read “There’s more to the story than ‘high interest rates are bad for stocks’ 🤨,“ “Business finances look great 💰,“ and “Why repaying $500 can be harder than repaying $1,000 🤔“
Companies are investing in their business
“Despite macro uncertainty, capex spending has remained strong, accelerating to +24% YoY in 3Q, driven by Energy and Communication Services,“ Savita Subramanian, head of U.S. equity strategy at BofA, observed on Friday.

BofA expects the U.S. economy to go into recession this year.
“Although capex is typically pro-cyclical, we see several reasons that capex will be more resilient during this recession than in the past, including persistent supply challenges, the need to spend on automation amid wage inflation/tight labor market, reshoring, underinvestment by corporates for decades, and the energy transition.“
For more on capex spending, read “9 reasons to be optimistic about the economy and markets 💪“ and “Three massive economic tailwinds I can’t stop thinking about 📈📈📈.“
Watch for stocks to decouple during earnings season
“We look for price dispersion to rise over the next ~6 weeks as it has done throughout prior earnings seasons,” Mike Wilson, chief U.S. equity strategist at Morgan Stanley, wrote on Monday.
Dispersion reflects the degree to which individual stocks move together.
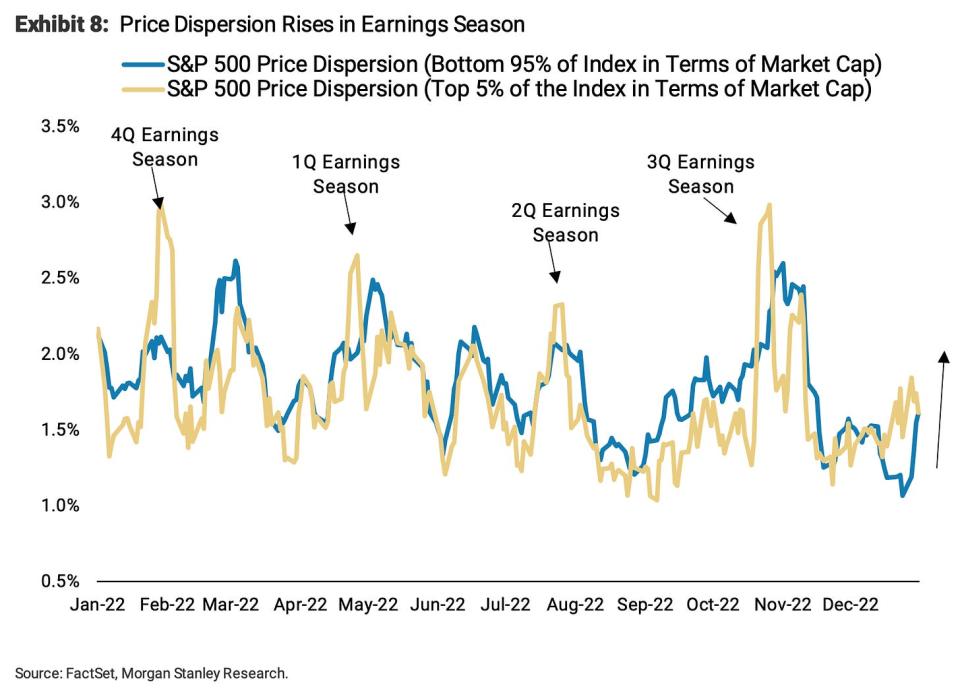
While Subramanian believes capex spending will hold up, Wilson argues that companies cutting back will be see their stock prices outperform.
“In our view, a key driver of this pick up in dispersion will be the widening relative performance gap between those companies that are operationally efficient in this challenging macro environment and those that are not,” he said. “In this sense, we think companies that minimize capex, inventory and labor investment and maximize cash flow will be rewarded on a relative basis.”
Subscribed
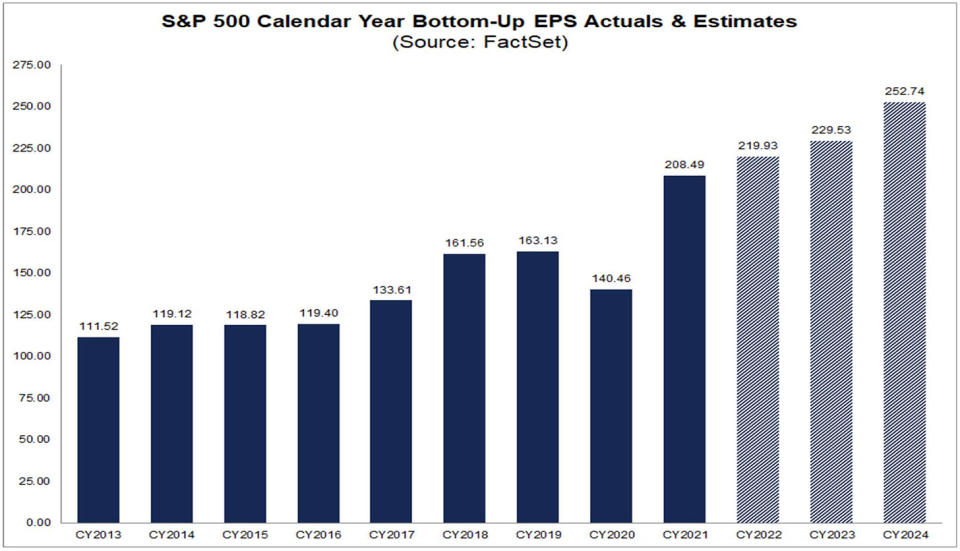
Analysts expect earnings growth in 2023 and 2024
According to FactSet, analysts are expecting S&P 500 earnings per share (EPS) to rise to $229.53 in 2023 and $252.74 in 2024.
For more bullish metrics, read “9 reasons to be optimistic about the economy and markets 💪.“
However, those expectations have been coming down
From FactSet:
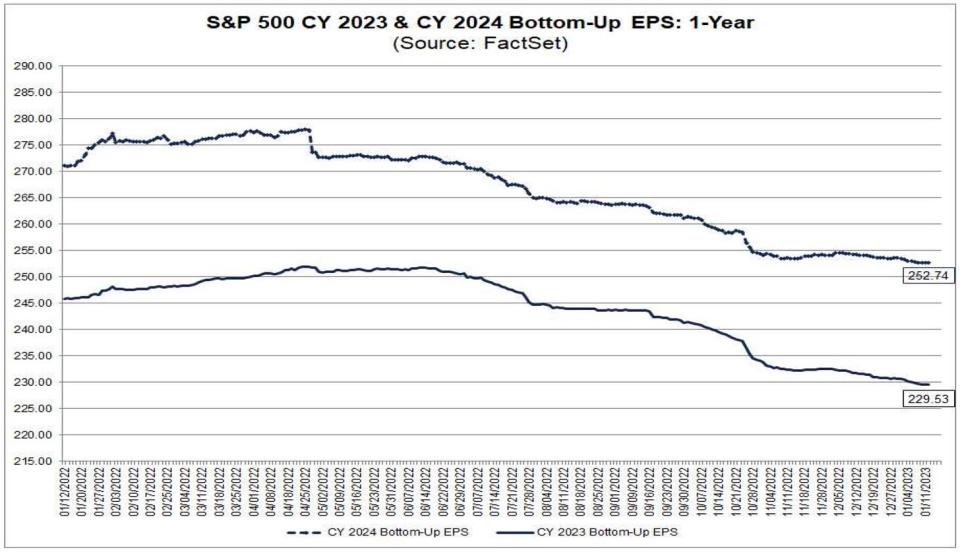
There’s no shortage of strategists expecting these numbers to be revised lower. For more, read “One of the most frequently cited risks to stocks in 2023 is ‘overstated’ 😑.“
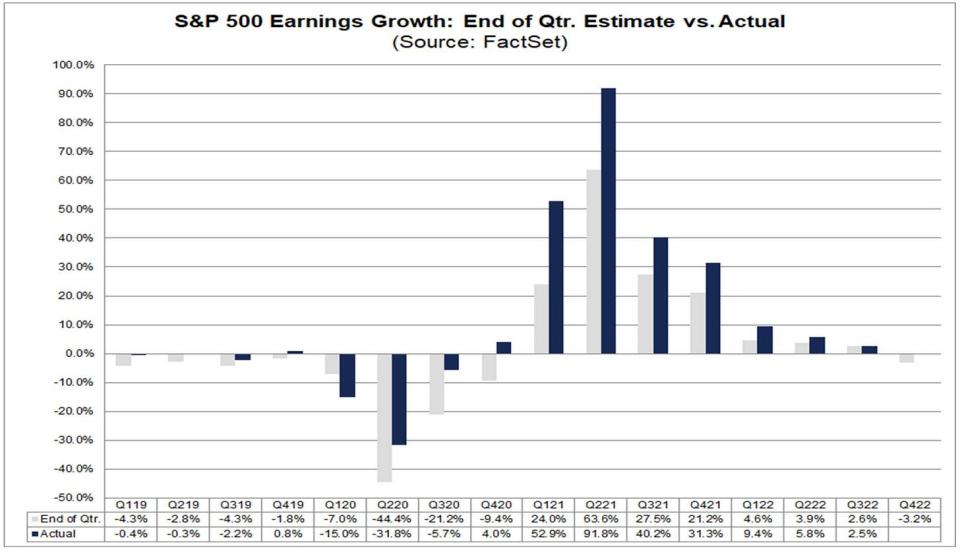
Earnings growth usually beats estimates
From FactSet: “…the actual earnings growth rate has exceeded the estimated earnings growth rate at the end of the quarter in 38 of the past 40 quarters for the S&P 500. The only exceptions were Q1 2020 and last quarter (Q3 2022).”
For more on this, read “‘Better-than-expected’ has lost its meaning 🤷🏻♂️“ and “The truth about analysts’ deteriorating expectations 📉.“
Valuations bottom before expected earnings
“In prior bear markets, equities have troughed ~1m before the ISM bottoms, but 1-2 months after financial conditions peak,” Keith Parker, head of U.S. equity strategy at UBS, wrote in a January 4 note. “The market bottom coincides with the P/E bottom in almost all instances, with a rise in the P/E typically following a fall in corporate bond yields.“
The chart below shows the P/E bottom also precedes the bottom in forward earnings estimates.

For more on P/E ratios, read “Use valuation metrics like the P/E ratio with caution ⚠️.“ For more on stocks bottoming, read “Stocks usually bottom before everything else.“
In the long run, earnings go up
Deutsche Bank’s Binky Chadha expects Q4 earnings of $53.80 per share for the S&P 500. This would bring EPS closer to its long-run trend, which is up and to the right.

For more on long-term earnings, read “Expectations for S&P 500 earnings are slipping 📉“ and “Legendary stock picker Peter Lynch made a remarkably prescient market observation in 1994 🎯.“
Great years follow horrible years
“In the past 90 years, the S&P 500 has only posted a more severe loss than its 19.4% annual decline in 2022 on four occasions – 1937, 1974, 2002, and 2008,” Brian Belski, chief investment strategist at BMO Capital Markets, observed on Thursday. “In the subsequent calendar years, the index logged >20% gains each time with an average price return of 26.5% as highlighted in Exhibit 8.“

For more on short-term patterns in the stock market, read “2022 was an unusual year for the stock market 📉“ and “Don’t expect average returns in the stock market this year 📊“
Subscribed
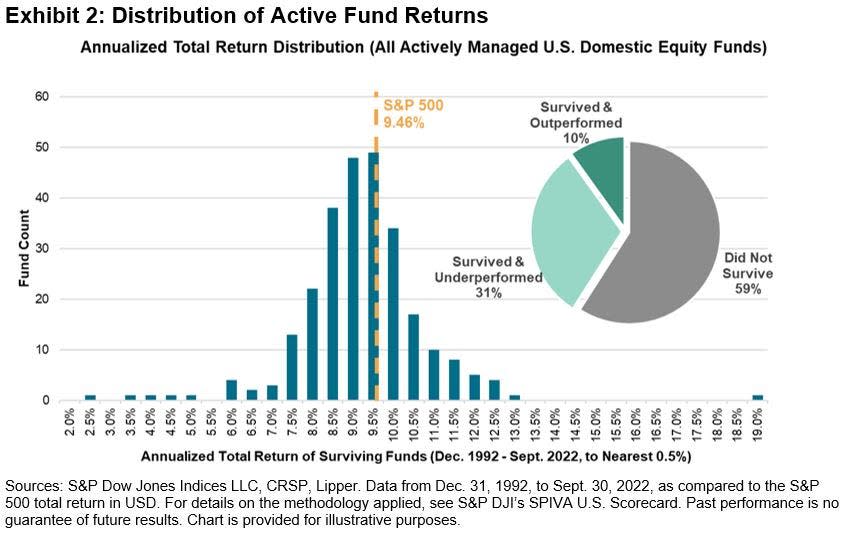
Not many ETFs beat the S&P 500
From S&P Dow Jones Indices: “On Jan. 29, 2023, the world’s longest-surviving exchange-traded fund — initially known as the Standard & Poor’s Depository Receipt or by the acronym SPDR (the “Spider”) — will celebrate 30 years since it began trading… Investing in an index tracker was seen (by some) as an admission of defeat back in early 1993. At best, an index fund was “settling for average.” But, as it turns out, a portfolio approximately replicating the S&P 500’s return would have been emphatically above average since then.”
For more on this, read “Most pros can’t beat the market 🥊“
Most consumers expect stocks to fall
From the NY Fed’s Survey of Consumer Expectations: “The mean perceived probability that U.S. stock prices will be higher 12 months from now decreased by 0.8 percentage point to 34.9%.“

For more on this, read “Most of us are terrible stock market forecasters 🤦♂️.“
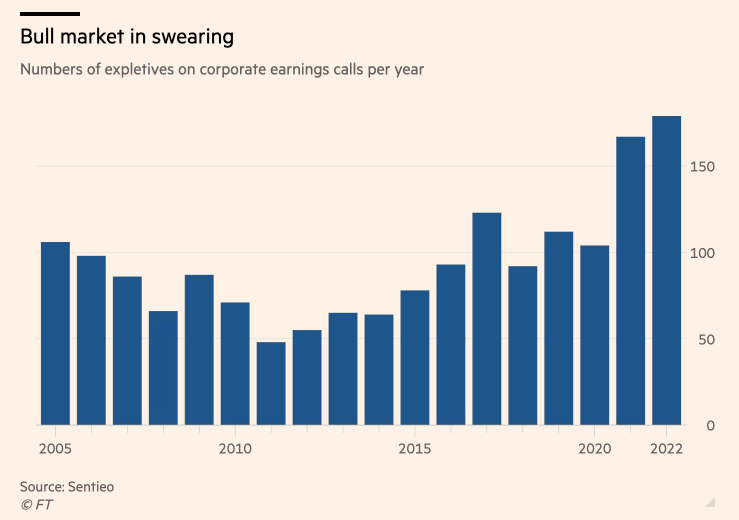
BONUS: Execs are talking sh*t on earnings calls
From the FT’s Robin Wigglesworth: “Using AlphaSense/Sentieo’s transcription search function, we can see that the ‘polycrisis’ of runaway inflation, pandemics, interest rate increases, supply chain snafus and wars helped lift swearing on earnings calls and investor days to a new record high in 2022. Sadly, when we first looked into this last year it turned out that most of the redacted swear words were pretty plain vanilla, like ‘shit’ and ‘bullshit.’“
It’s a lot to process. Indeed, investing in the stock market can be complicated.
Overall, there seem to be a lot of reasons to be optimistic. And the reasons to be pessimistic aren’t particularly out of the ordinary.
For many more charts on the stock market, read “2022 was an unusual year for the stock market 📉.“
–
Related from TKer:
Reviewing the macro crosscurrents 🔀
There were a few notable data points from last week to consider:
🎈 Inflation continues to cool. The consumer price index (CPI) in December was up 6.5% from a year ago, down from 7.1% in November. Adjusted for food and energy prices, core CPI was up 5.7%, down from 6.0%.
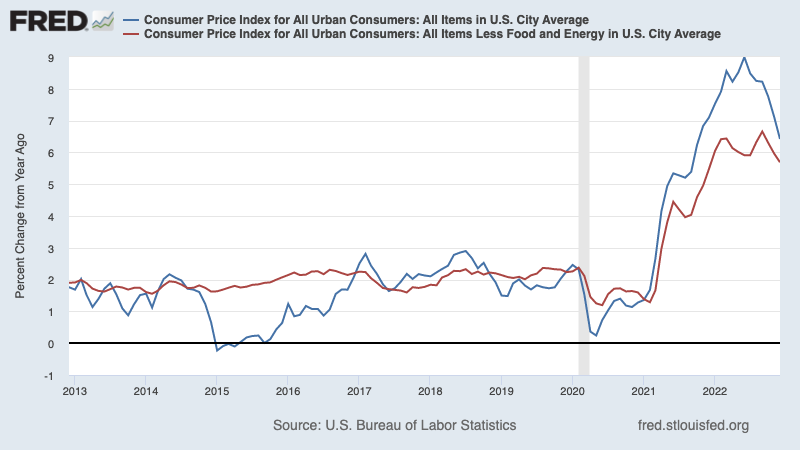
On a month-over-month basis, CPI was down 0.1% and core CPI was up 0.3%.
If you annualized the three-month trend in the monthly figures, CPI is rising at a cool 1.8% rate and core CPI is climbing at a just-above-target 3.1% rate.

For more on the implications of cooling inflation, read “The bullish ‘goldilocks’ soft landing scenario that everyone wants 😀.“
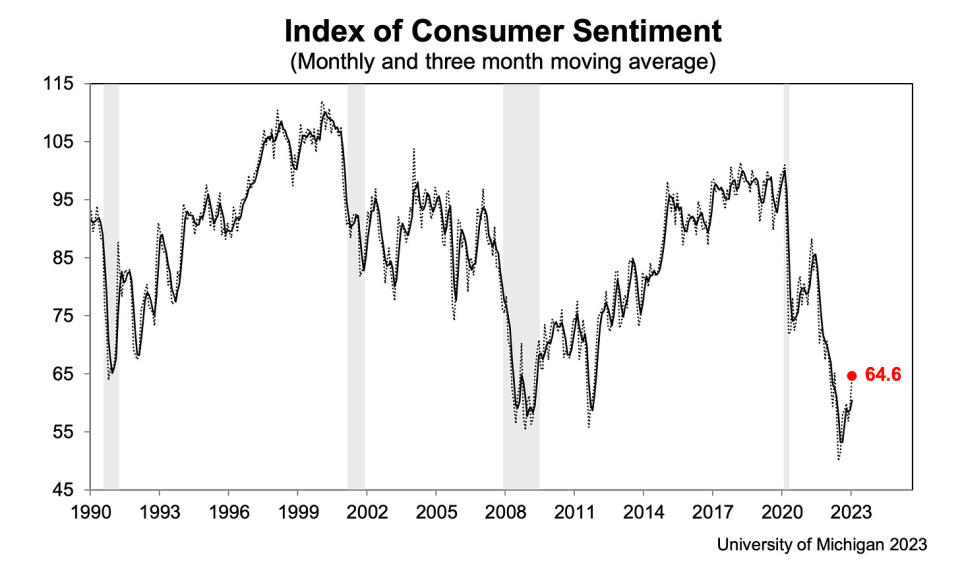
👍 Consumer sentiment improves. From the University of Michigan’s December Survey of Consumers: “Consumer sentiment remained low from a historical perspective but continued lifting for the second consecutive month, rising 8% above December and reaching about 4% below a year ago. Current assessments of personal finances surged 16% to its highest reading in eight months on the basis of higher incomes and easing inflation… Year-ahead inflation expectations receded for the fourth straight month, falling to 4.0% in January from 4.4% in December. The current reading is the lowest since April 2021 but remains well above the 2.3-3.0% range seen in the two years prior to the pandemic.“
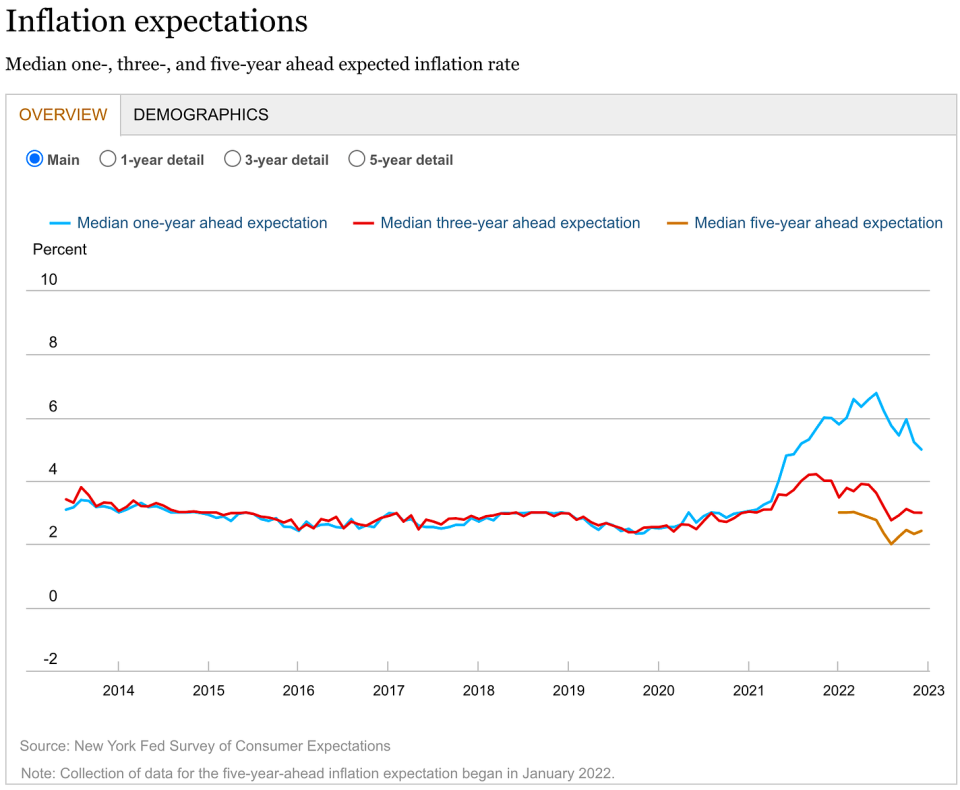
👍 Expectations for inflation improve. From the NY Fed’s December Survey of Consumer Expectations: “Median one-year-ahead inflation expectations declined to 5.0%, its lowest reading since July 2021, according to the December Survey of Consumer Expectations. Medium-term expectations remained at 3.0%, while the five-year-ahead measure increased to 2.4%.“
💳 Consumers are taking on more debt. According to Federal Reserve data released Monday, total revolving consumer credit outstanding increased to $1.19 trillion in November. Revolving credit consists mostly of credit card loans.

💳 Credit card interest rates are up. From Axios: “The Federal Reserve’s most recent report on costs of consumer credit showed average interest rates on bank-issued credit cards touching 19.1% in the fourth quarter. That beats the previous record high — 18.9% — set in the first quarter of 1985.“

💳 Credit card delinquencies are low, but normalizing. From JPMorgan Chase’s Q4 earnings announcement: “We expect continued normalization in credit in 2023.“ The bank’s outlook assumes a “mild recession in the central case.“ For more on this, read “Consumer finances are in remarkably good shape 💰“

💰 Overall consumer finances are stable. From Apollo Global Management’s Torsten Slok: “…households across the income distribution continue to have a higher…
Read More:Some stock market charts to consider as we look forward
2023-01-15 17:17:00