
It nailed the top last November and it nailed the tops and bottoms going back at least to the 1990s.
By Wolf Richter for WOLF STREET.
Increases and decreases in leverage, when large enough, drive markets up or down. The only summary data on stock-market leverage that we can get is margin debt, reported monthly by FINRA, which obtains the data from its member brokers. There is a lot more leverage in the market, but we don’t get a summary figure of it. Margin debt is our stand-in for overall stock market leverage.
Margin debt data that was released last November, for the month of October, nailed the top in the stock market, as margin debt had nailed prior tops. More on that in a moment, including my annotated long-term chart. Now we’re looking for signs of a bottom. But as of the latest release of margin debt, we’re far from any bottom.
Margin debt fell by $24 billion in September from August, to $664 billion. But it is still very high, 39% above the March 2020 low. The drops in margin debt in January and February 2020 showed that there was already concern that Covid might be tearing up the markets, and some investors prepared by reducing their leverage. At the current level, margin debt has a lot more room to fall – and the process can take years as we’ll see in a moment – before it signals a bottom in the stock market.
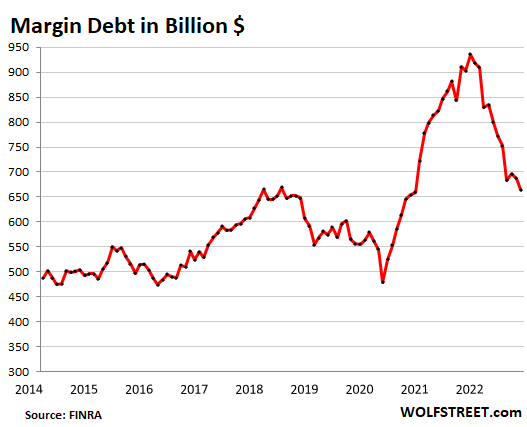
In the chart above, you can see that the summer rally was doomed to be just another bear-market rally because margin debt didn’t jump with it; it barely ticked up a little and then fizzled.
Leverage is a huge factor in the direction of any market. Leverage is the great accelerator on the way up, and on the way down. Big spikes in margin debt led invariably to stock market “events,” and a bottoming out of margin debt either preceded or closely followed the bottom of the sell-off.
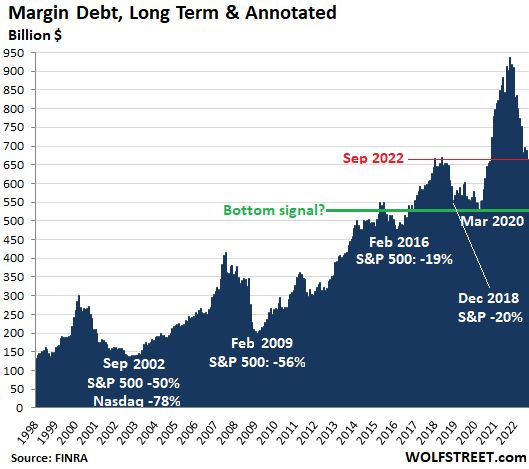
The bottom signal occurs when margin debt drops to the lows from a few years earlier and then starts rising again.
In the long-term view of margin debt, it’s not the absolute dollar amounts that matter, but the steep spikes in margin debt before the selloffs and the declines that start with the sell-off, and bottom out at the end of the sell-off.
The long-term chart below of margin debt also shows stock market events. Margin debt will need to fall somewhere near a prior low established several years before the spike in order to give a bottom signal.
The Dotcom Bust started in the middle of March 2000 (Nasdaq Composite hit 5,048), which was also the month when the spike in margin debt peaked. Margin debt bottomed in October 2002, having fallen to a level of 1998, after the Nasdaq Composite had plunged 78%. Then both began to rise again.
The Financial Crisis crash was preceded by a huge spike in margin debt to a peak in July 2007. Then margin debt fell. The Nasdaq started falling on November 1, 2007, from 2,859, plunging 55% to 1,268 by March 2009. Margin debt bottomed in February 2009, reported in March 2009. The stock market bottomed in March 2009.
As you can see, this process takes years – not months! Margin debt is not an indicator for day traders or short-term speculators that bet on daily ups and downs, but an indicator of longer-term trends.
Stock market leverage predicts stock-market moves in a somewhat indirect way: When the market starts a mundane regular little sell-off, high leverage triggers bouts of selling — usually of the most speculative stocks that shot up the most, and that then are the first to plunge — to pay down leverage to avoid margin calls, and it triggers bouts of forced selling as margin calls are going out. Leveraged investors have to sell stocks to pay down their margin debt, and this selling pushes down prices further, which triggers more forced selling, and more fears of forced selling, etc.
On the way up, increasing margin debt increases the buying pressure in the market, funded with borrowed money. And stock market bubbles need lots of leverage to get there.
Margin debt is the great accelerator on the way up, as buying stocks with borrowed money creates new buying pressure that drives up prices.
And in the reverse manner, margin debt is the great accelerator on the way down, as this borrowed money gets drawn out of the market by selling stocks, just when new money is reluctant to come into the market to buy those stocks at those prices, but is willing to buy those stocks at lower prices. And the money that margined investors drew out then vanishes into paying off the margin debt — instead of sitting on the “sidelines” somewhere.
Enjoy reading WOLF STREET and want to support it? Using ad blockers – I totally get why – but want to support the site? You can donate. I appreciate it immensely. Click on the beer and iced-tea mug to find out how:

Would you like to be notified via email when WOLF STREET publishes a new article? Sign up here.
![]()
Read More:Margin Debt Is Still Far from Calling a Bottom for Stocks
2022-10-21 20:59:46