
Inside This Week’s Bull Bear Report
- Bullish Trend At Risk As Market Selloff Continues
- Downside Risk Remains, But Rally First
- How We Are Trading It
- Research Report – Deflation Will Be THE Problem
- Youtube – Market Recap With Adam Taggert
- Stock Of The Week
- Daily Commentary Bits
- Market Statistics
- Stock Screens
- Portfolio Trades This Week
Bullish Trend At Risk
Another volatile market week continues to weigh on investor psychology. Such remains the most dangerous part of a bearish market, as emotions begin to take over logical investment processes. The market traded quietly early in the week in anticipation of the September inflation report, which was much hotter than expected. On that news, the market initially broke down but mustered a strong rally of 5.5% from the lows.
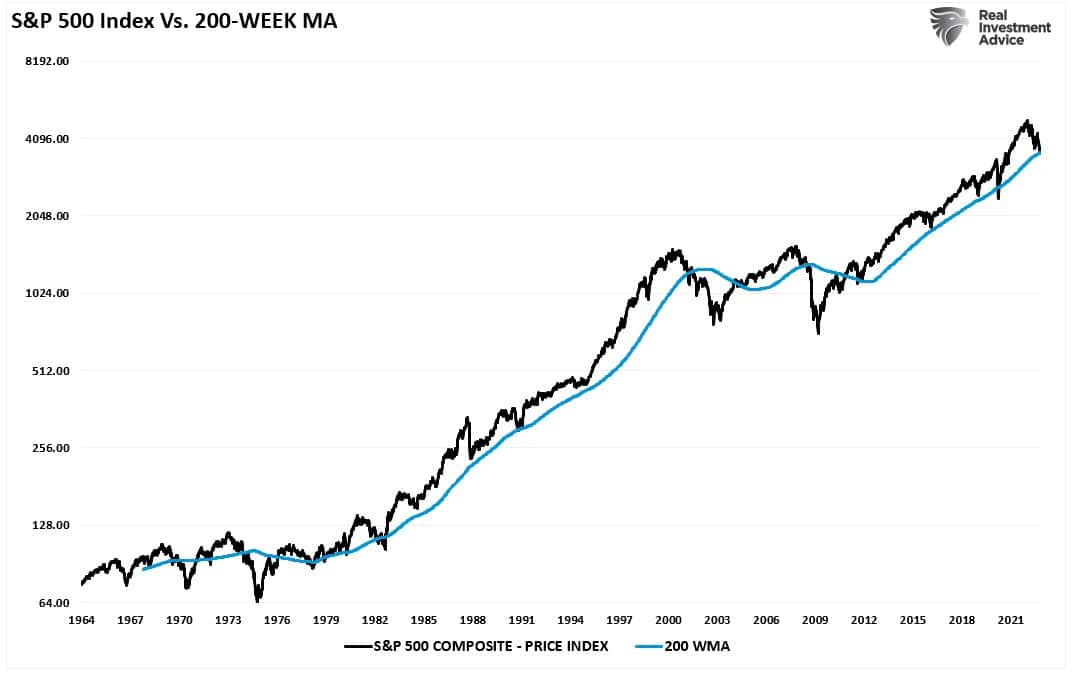
Notably, the market continues to flirt with support at the 200-week moving average, which has defined the “bullish trend” since the financial crisis lows. In other words, despite the “correction” from this year’s highs, the ongoing bull market remains intact. However, a “confirmed break,” which will be a close, retest, and failure of that bullish trend, will constitute a bear market.
This is an important point.
While the mainstream media continues to define the current decline as a “bear market,” it remains a “correction” within the bullish trend. Many factors don’t currently exist that coincide with previous bear market cycles.
- Surging unemployment
- Recession
- Bankruptcies
- Defaults
- Fed cutting rates
- Falling 2-year and 10-year Treasury yields
- Un-inversion of the yield curve.
- Spiking credit spreads
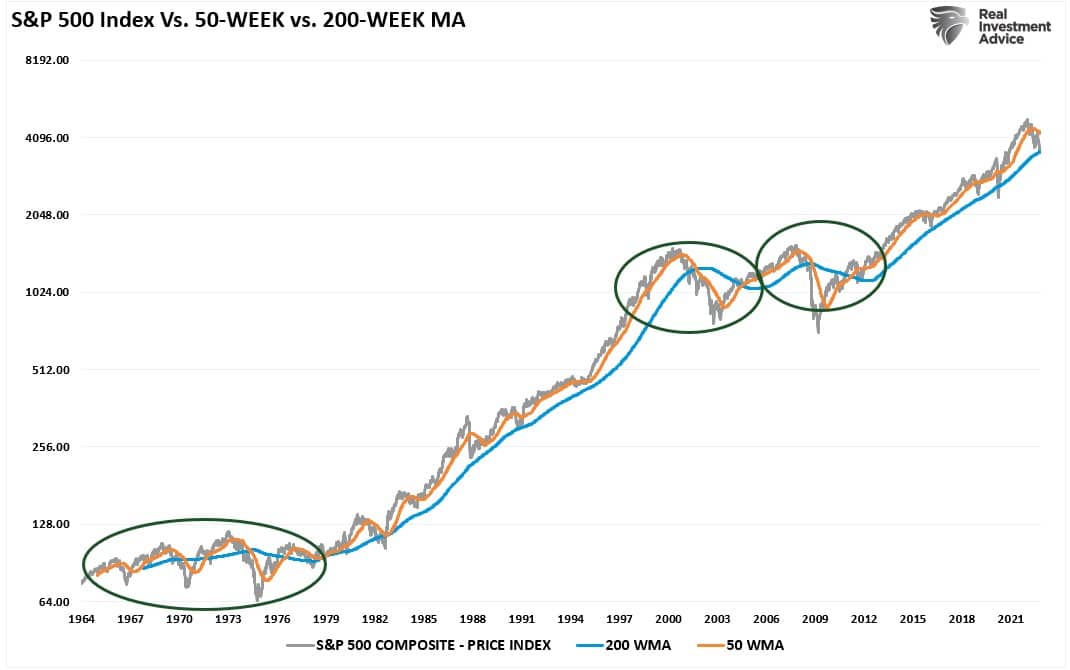
In all previous “bear markets,” the bullish trend failed, and the 50-week moving average crossed below the 200-week.
Yes, those things may come, and if they do, we will see the bullish trend broken, and the Fed will reverse course. BofA had a great table on this.

With the market oversold on a short-term basis, and longer-term deviations more extreme, we continue to look for a reflexive rally. Use any rally to raise cash levels and reduce equity risk accordingly.
Need Help With Your Investing Strategy?
Are you looking for complete financial, insurance, and estate planning? Need a risk-managed portfolio management strategy to grow and protect your savings? Whatever your needs are, we are here to help.

Forward P/E’s Still Not Cheap
There are some important considerations with the chart above. While the bullish trend remains intact, there is a reasonable probability the trend line will break before this cycle completes. The reason is that while we are certainly due for a robust counter-trend rally, the market has likely not accounted for an earnings recession in 2023 as a global recession takes hold.
We discussed the risk to earnings in last week’s newsletter, stating:
“The Fed’s inflation-fighting measures of hiking rates and reducing its balance sheet do not support a market bottom. Why market participants are expecting “this time to be different” is a bit beyond my ability to rationalize.
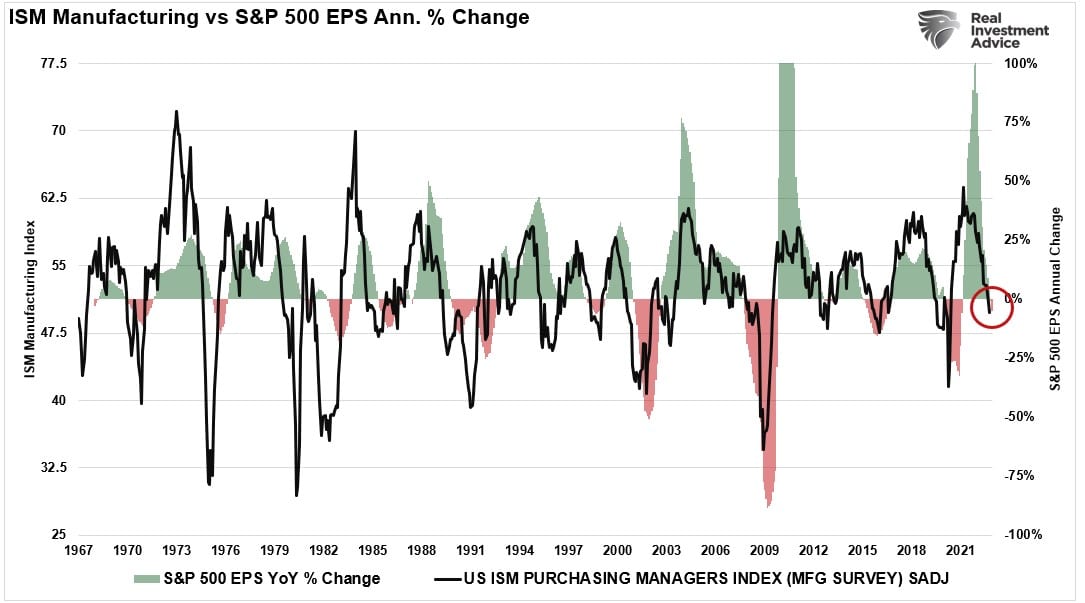
Such is particularly the case as we head into earnings season. We previously noted the high correlation between the ISM Manufacturing Index and corporate earnings. With the latest release of the ISM Index, the economic backdrop continues to deteriorate, suggesting earnings growth rates will decline further.”
Of course, that commentary elicited an email question:
“But Lance, earnings estimates have come down and forward P/E ratios have dropped markedly.”
While that is a true statement, here is the problem with an earnings recession and why the bullish trend is at risk.
The P/E Trick
The forward price/earnings ratio assumes that the market’s current price (P) and earnings (E) are stagnant. For example, the S&P 500 Price = 3600, and the 2023 year-end earnings estimates are $209 per share. If we divide the price by the earnings, we get a FORWARD P/E ratio of 17.22.
However, if we have a further earnings decline, which would be consistent with previous historical recessions, such is where current forward valuations become problematic. We can make some assumptions in the following table.
The first column assumes the market price remains the same as earnings decline. The second column assumes valuations remain stagnant as earnings decline.

If the market’s price remains stagnant, valuations will rise from 17x forward earnings to 22.6x. However, if you buy the market today based on paying 17x forward earnings, the market price will have to fall to accommodate lower earnings. If an earnings recession occurs, falling prices and earnings will jeopardize the long-term bullish trend discussed above.
Foreward P/E assumptions are problematic as they do not account for future changes. Those changes are coming, and they will likely be considerably larger than most investors expect, particularly if something “breaks” economically.
However, such does not mean we can’t have a big rally first.
Another Bear Market Rally Remains Likely
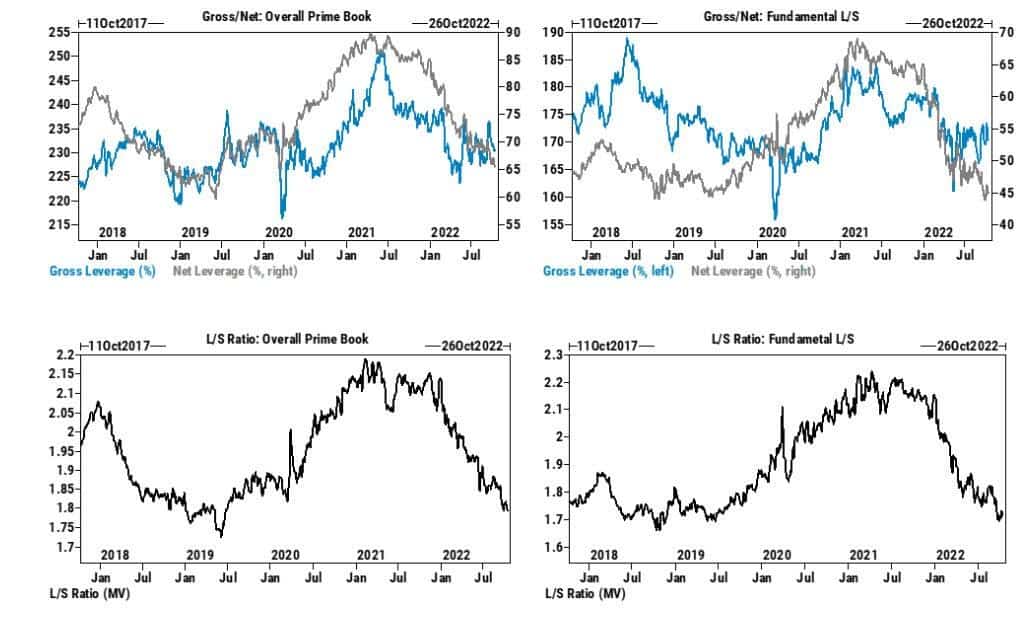
As we have discussed over the last couple of weeks, the market remains grossly oversold, sentiment is extremely negative, and professional managers carry very light exposure. Furthermore, with hedge fund exposure to the lowest levels in 5-years, a rally remains likely.
The fuel for a short-covering rally remains, considering the substantial short positions and near-record put options.

This year, the sheer magnitude of consecutive down days in the market has been the largest since 1974. Also, as noted by @TheMarketEar earlier this week:
- The systematics traders (algos) have been huge sellers over the past few weeks
- The quarter-end saw pension funds de-risking portfolios
- Retail traders have finally started to capitulate
- US corporates are in black-out
- Mutual funds have been raising cash levels
- Massive short gamma position has magnified the moves
- QT is ramping up; the last 3-weeks saw the largest reduction in over 2-years
As a consequence, there are many signals suggesting the market is “washed out.”
“For only the 36th time since 1930, the Composite Washout Model triggered a new alert when the 10-day rate of change for the S&P 500 turned positive on Thursday. The previous alert occurred in June, leading to a 13% rally when measured from the publish date to the August peak in the S&P 500.” – Sentiment Trader

With so much selling over the last few weeks, it has left large imbalances on the books of portfolio managers. According to Goldman’s Scott Rubner, there is a potential $217 billion in net buying if a market rally gains traction. However, while we could see another rally like July and August, it remains an opportunity to reduce risk and rebalance portfolios.
When Will The Bearish Trade End?
Such brings us to THE question.
“When will the bearish market end?”
The honest answer is, “I don’t know.”
I am growing more confident that we are moving well into the 7th inning of this current down market cycle. Sentiment, as noted, is negative, but valuations remain expensive on both a trailing and forward basis. The valuation problem will need to resolve itself before we reach a bottom. Currently, valuations remain well above the previous trough of every previous bear market cycle.
Importantly, valuations will likely revert past the exponential growth trend before completion. As noted above, such will be a combination of declining prices to adjust for declining earnings.
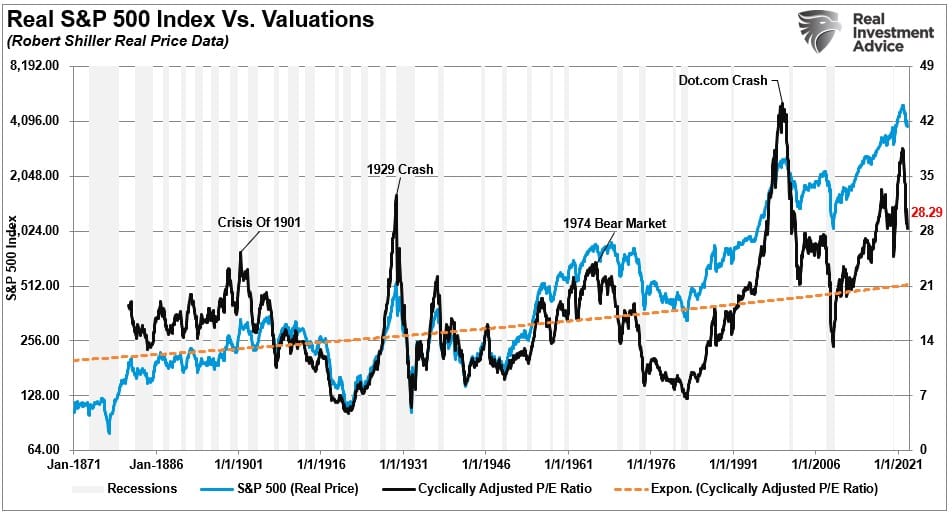
What would such a reversion look like?
If we assume 17x trailing CAPE valuations is realistic, and an earnings recession leads to $170-180 / share in earnings, then a price target of 3000-3100 is reasonable. From peak to trough, such would be a drawdown of roughly 36.5%, which is well within the context of a break of the bullish trend and a bear market. However, a 15x valuation at $180 / share is 2700, or a decline of 44%.
Clearly, there is downside risk.
However, going forward, the markets will have better inflation numbers, not-so-terrible earnings, given lowered estimates, and more extreme negative sentiment. Such will provide the lift for a rally that will likely “sucker” investors into thinking the bear market is over.
It likely won’t be.
As BofA laid out this past week, many factors are missing to suggest the market has made a bottom.

The economic data, including employment, will worsen as the effect of the excessive rate hikes to date become realized. That will happen in 2023 as the lag effect occurs in the first half of next year.
Just remember, the biggest up days almost entirely happen in bearish markets.
Not Getting The Bull Bear Report Each Week In Your Mailbox? Subscribe Here For Free.
How We Are Trading It
So far, 2022 remains an extremely tough market to trade. However, as long as the long-term bullish trend remains intact, we maintain some equity exposure. We will further reduce equity exposure if the market violates the bullish trend. As noted last week, we started implementing tax loss harvesting to rebalance portfolios for the end of the year.
Given the market’s deeply oversold conditions, we are holding some additional equity exposure we added previously for the expected reflexive market rally. While we anticipate a decent rally in the weeks ahead, particularly as we move past October and corporate share buybacks restart, we will use that rally to reduce exposure further and rebuild cash levels accordingly.
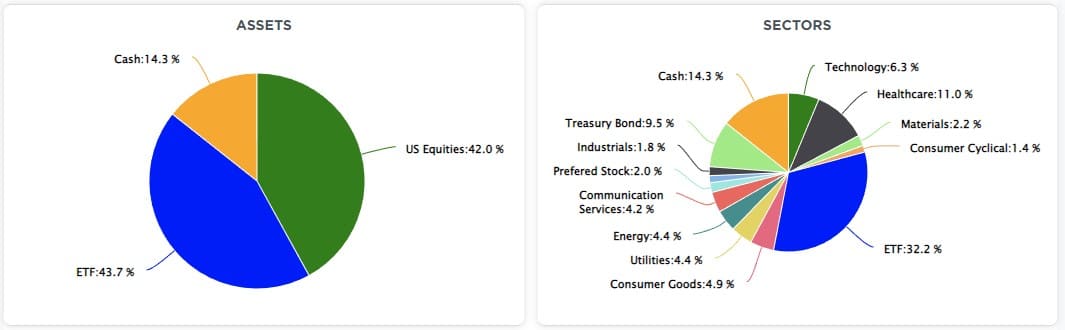
Despite the modest equity increase, we remain underweight in stocks and bonds and overweight cash and short-term Treasuries. (The ETF allocation comprises short-duration Treasury bonds and floating rate Treasuries, with a lesser allocation to long-dated Treasuries. You can view our models in real-time at SimpleVisor.com)
Navigating The Market Rally
We continue to suggest following the guidelines we laid out previously during any market rally over the next few weeks.
- Move slowly. There is no rush to make dramatic changes. Doing anything in a moment of “panic” tends to be the wrong thing.
- If you are overweight equities, DO NOT try and fully adjust your…
Read More:Bullish Trend At Risk As Market Selloff Continues
2022-10-15 20:54:57