
Commercial Real Estate hit by construction boom, oil bust, pandemic, working from home, now hiring freezes and layoffs. Older office towers dish out huge losses.
By Wolf Richter for WOLF STREET.
The news for the office sector of commercial real estate just keeps getting worse. Some tech and social media companies have announced hiring freezes, including Facebook and Twitter. Others have made cutting costs suddenly a priority, promising very constrained hiring, such as Uber. Numerous startups are laying off people, included used-car online dealer Carvana, which fired 2,500 workers last week. Mortgage lenders from Wells Fargo on down have started laying off significant portions of their employees as mortgage lending is now in the dumps.
In addition, there is the shift working from home for office employees, and hybrid models where employees show up at the office only every now and then.
All this follows years of office construction booms. New office towers are being completed and put on the market with the latest and greatest amenities, and these trophy towers are competing with older office towers for shrinking office needs.
A widespread flight to quality has set in: When leases in older towers terminate, the tenants move to the trophy towers, and leave the older towers vacant. And landlords cannot lower the rents enough because they wouldn’t be able to meet their mortgage payments. So, the office sector of commercial real estate is facing an ugly reality.
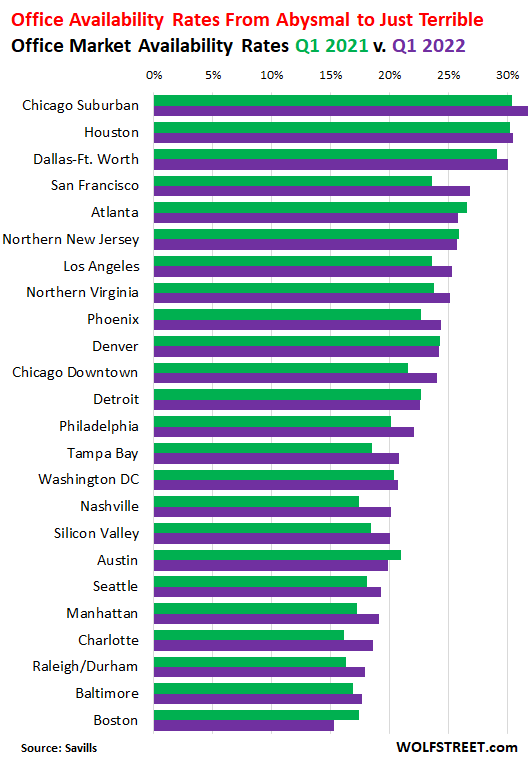
Availability rates, which sounds a less bad than vacancy rates, have shot up during the pandemic, and in many cities have continued to rise through Q1 2022, and are now in the astronomical zone.
The worst four office markets in terms of availability rates are Chicago Suburban (31.7%), Houston (30.5%), Dallas-Fort Worth (30.9%), and San Francisco (26.8%), according to data from Savills.
In San Francisco, for example, the availability rate of 26.8% was a new record worst in the data, and was up from an availability rate of 7.3% in Q3 2019. In 2017 and 2018, San Francisco was the hottest tightest office market in the US. It was called “office shortage,” where companies were leasing or buying office space they didn’t need, and to hog this space, before anyone else could get it, so that they’d have space to eventually grow into.
Now there are 23.1 million square feet (msf) of available office space on the market in San Francisco, according to Savills, up from 6.1 msf in 2019. And new construction is still coming on the market.
Meta, for example, back in 2018, when it was still Facebook, leased an entire office tower in San Francisco, in addition to all the other office space it already had in the City, in Silicon Valley, and elsewhere. “This new space will support our growing workforce as we continue to attract talent,” Facebook said in a statement. It has since signed more leases in Silicon Valley. Then came the pandemic and working from home, and now the hiring freeze. So who needs all this office space?
This is how the market in San Francisco turned from an endlessly hyped office shortage to an endless office glut that no one knows what to do with.
But San Francisco isn’t the worst office market. That honor goes to the Chicago Suburban market, Houston, and Dallas-Fort Worth – all of them with availability rates above 30%, according to Savills.
Houston had for years the worst office market in the US, starting in 2015 when an office construction boom smacked into the oil bust, where a slew of Texas-based oil and gas companies filed for bankruptcy, and where the entire industry went through major bouts of cost cutting, layoffs, and footprint reduction. Houston’s availability rates soared. Then came the pandemic and working from home, and it got even worse.
It’s not the new office towers that get in trouble; They attract tenants by offering them the latest and greatest, and a flight to quality sets in that leaves older office towers vacant, and they default on their debts and dish out huge losses to the holders of this debt, usually investors in Commercial Mortgage Backed Securities (CMBS) that these mortgages were rolled into; or banks, insurance companies, and other investors that hold mortgages outright.
For example, in Houston, two office towers, built in the 1980s on the same campus, recently were sold in a foreclosure sale, first Three Westlake Park, and then Two Westlake Park. After fees and expenses, investors ate losses on the mortgages of 81.9% and 88.3% respectively, as the value of these older office towers has collapsed due to lack of demand.
And there is a flood of sublease space on the market where tenants that don’t need the space are putting it on the market in the hopes of finding a tenant that would help lower the carrying costs of the space until the lease expires. Companies that put their vacant space on the sublease market tend to undercut landlords because they don’t need to make a profit on the space; they just want to recoup some of their costs.
There were hopes in the second half last year that the sublease space had seen the peak, as companies were either finding tenants for the sublease space or taking it off the market. But in Q1, the sublease space grew again by 3.6% from Q4, to 159 million square feet, according to CBRE, cited by the Wall Street Journal.
Despite the astronomic availability rates, landlords have not broadly cut their asking rents, and in many markets have raised them. There are some exceptions, including San Francisco, where asking rents have fallen.
But whatever asking rents may be, landlords are negotiating and making deals, and are offering all kinds of incentives, from periods of free rent to large build-out allowances, in order to sign tenants for their empty space.
So here are 24 major office markets in the US (update: I just added Nashville to the original 23 after Savills released the data a few hours after this was published), and their availability rates in Q1 2021 (green) and Q1 2022 (purple), in order from abysmally worst to just terrible, with the least worst on this list, Boston, having an availability rate of 15.3%.
In six of the 24 markets, availability rates fell year-over-year, and the most in Boston (by 2.0 percentage points).
In 18 of the 24 markets, availability rates worsened year-over-year, and they worsened the fastest in San Francisco (by 3.2 percentage points), in Nashville (by 2.7 percentage points), in Charlotte (by 2.5 percentage points), in Chicago Downtown (by 2.4 percentage points), and in Tampa Bay (by 2.3 percentage points):
Enjoy reading WOLF STREET and want to support it? Using ad blockers – I totally get why – but want to support the site? You can donate. I appreciate it immensely. Click on the beer and iced-tea mug to find out how:

Would you like to be notified via email when WOLF STREET publishes a new article? Sign up here.
![]()
Read More:My List of 23 Major US Office Markets, by Vacancy Rates Ranging from Abysmal to Just Terrible
2022-05-17 01:50:38