
Everything is on ice. But when forbearance ends, forced sellers or lenders will put millions of these homes on the market.
By Wolf Richter for WOLF STREET.
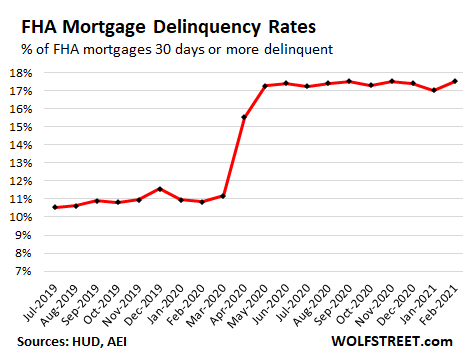
On the other side of the red-hot housing market, a historic delinquency problem has been fermenting since last spring, largely put on ice and on hold by forbearance programs, waiting to be dealt with. The Federal Housing Administration (FHA) which insures nearly 8 million high-risk mortgages, reported that the delinquency rate of its mortgages rose to 17.5% in February, up from 17.0% in January, matching the all-time records of September and November last year, according to the AEI’s Housing Center.
“Low down payments, low closing costs, and easy credit qualifying,” the FHA promises. So FHA mortgages always have high delinquency rates, even during the Good Times, when they were already rising. But during the Pandemic, delinquencies ballooned, and they’re not improving in any way despite the improving economy:
The delinquency rate for the largest 169 Metropolitan Statistical Areas (MSAs), rather than the US overall, accounting for about 6 million of FHA mortgages, rose to 17.9%.
“Seriously delinquent” mortgages – 90 days or more delinquent – in February rose to a record 12.0% for the US overall and to 12.4% for the largest 169 MSAs.
The delinquency rate exceeded 20% in 30 of the 169 largest MSAs, topping out in the metro of Nassau County-Suffolk Country, NY, at 24.8%. Among those 30 metros with 20%+ delinquency rates were 4 metros in Texas, 4 metros in Louisiana, 3 metros in New York, 3 metros in New Jersey, and 2 metros in Pennsylvania.
And when forbearance ends?
Rumors of perma-forbearance are now floating around, given the multiple extensions of the forbearance programs that no one has any political appetite to let expire. But those are just rumors. Eventually, those programs will end, and then the delinquent mortgages will have to be dealt with.
Borrowers who can do so will resume making payments, either with the missed principal and interest added to the end of the mortgage, or with the lender agreeing to modify the mortgage. This would cure the delinquency and bring the mortgage current.
Borrowers who cannot or don’t want to make mortgage payments can sell the home and use the proceeds to pay off the mortgage, including the missed interest payments. If the borrower fails to sell the home and pay off the mortgage, the lender can foreclose and sell the home. In either case, those homes are going to show up on the market.
Given the massive surge in home prices, a sale would be a logical solution for these borrowers who cannot make the payments. They might even walk away with a little extra cash.
But in markets with a large concentration of delinquent FHA mortgages, this would unleash a flood of homes coming on the market – and it would instantly cure, and more than cure, the inventory shortage now being lamented, and when large enough, the sudden supply of homes for sale would send bigger ripple effects through the market.
That’s why no one is eager to let the forbearance programs expire, and why it’s so hard to get out of this extend-and-pretend phase.
The AEI Housing Center identified 10 metros that are most at risk of this sudden supply of homes, with delinquent FHA mortgages showing up on the market. These are metros with both: a high share of FHA loans, and a high delinquency rate of those FHA loans. Note the large number of delinquent FHA loans in the second column, waiting for a resolution.
For example, in the Houston metro (#2), 48,483 FHA mortgages are delinquent, or 22.5% of all FHA mortgages in the market. Of them, 32,224 mortgages are “seriously delinquent.” This creates the potential that tens of thousands of homes flood the market over a relatively short period of time.
And those delinquent mortgages are just FHA-insured mortgages and do not include other delinquent mortgages.
| 10 Metros Most Threatened by FHA Delinquency Rates | ||||
| MSA | # delinquent FHA loans | % delinquent | % seriously delinquent | FHA Share by count |
| Atlanta-Sandy Springs-Alpharetta, GA | 50,499 | 20.4% | 14.5% | 21.0% |
| Houston-The Woodlands-Sugar Land, TX | 48,483 | 22.5% | 15.9% | 19.3% |
| Chicago-Naperville-Evanston, IL | 38,344 | 21.8% | 14.9% | 14.2% |
| Dallas-Plano-Irving, TX | 27,517 | 19.2% | 12.9% | 14.8% |
| Washington-Arlington-Alexandria, DC-VA-MD-WV | 27,243 | 21.1% | 15.7% | 13.7% |
| Riverside-San Bernardino-Ontario, CA | 21,770 | 17.1% | 11.9% | 20.6% |
| Baltimore-Columbia-Towson, MD | 20,899 | 19.9% | 14.1% | 19.4% |
| San Antonio-New Braunfels, TX | 17,881 | 19.6% | 13.0% | 19.3% |
| Orlando-Kissimmee-Sanford, FL | 15,593 | 18.7% | 13.8% | 21.6% |
| Tampa-St. Petersburg-Clearwater, FL | 15,459 | 16.5% | 11.9% | 19.6% |
With FHA loans, it’s not the lenders or investors that carry the risk. The FHA insures these mortgages; and the FHA being a government agency, it’s the taxpayers that carry the risk.
Inflated home prices theoretically reduce the costs of resolving these delinquent mortgages. But if a bunch of these homes suddenly show up on the market, as the floodgates of forbearance open and trigger forced selling, they will put downward pressure across the market, thereby increasing the costs of resolving those mortgages.
The table below shows the 169 MSAs and their FHA loans, in order of the overall delinquency rate of those FHA loans (3rd column). You can use the browser’s search function to find an MSA (if your smartphone clips the 5th column, hold your device in landscape position).
| MSA | # delinquent FHA loans | % delinquent | % seriously delinquent | FHA Share by count |
| NASSAU COUNTY-SUFFOLK COUNTY, NY | 13,660 | 24.8% | 19.3% | 15.4% |
| POUGHKEEPSIE-NEWBURGH-MIDDLETOWN, NY | 3,419 | 24.2% | 17.9% | 15.6% |
| NEW YORK-JERSEY CITY-WHITE PLAINS, NY-NJ | 21,074 | 24.2% | 19.1% | 9.7% |
| NEWARK, NJ-PA | 12,280 | 23.5% | 17.9% | 18.2% |
| LAFAYETTE, LA | 2,493 | 23.4% | 16.2% | 16.8% |
| NEW ORLEANS-METAIRIE, LA | 8,650 | 23.3% | 16.2% | 17.1% |
| FORT LAUDERDALE-POMPANO BEACH-SUNRISE, FL | 11,005 | 22.7% | 17.0% | 19.5% |
| HOUSTON-THE WOODLANDS-SUGAR LAND, TX | 48,483 | 22.5% | 15.9% | 19.3% |
| BATON ROUGE, LA | 6,219 | 22.1% | 14.3% | 19.8% |
| CHICAGO-NAPERVILLE-EVANSTON, IL | 38,344 | 21.8% | 14.9% | 14.2% |
| BRIDGEPORT-STAMFORD-NORWALK, CT | 3,437 | 21.8% | 16.5% | 12.0% |
| CORPUS CHRISTI, TX | 2,941 | 21.3% | 14.1% | 23.1% |
| SHREVEPORT-BOSSIER CITY, LA | 3,243 | 21.1% | 13.7% | 23.2% |
| WASHINGTON-ARLINGTON-ALEXANDRIA, DC-VA-MD-WV | 27,243 | 21.1% | 15.7% | 13.7% |
| MCALLEN-EDINBURG-MISSION, TX | 4,256 | 21.0% | 15.0% | 35.2% |
| CAMDEN, NJ | 12,118 | 20.9% | 14.9% | 26.1% |
| BEAUMONT-PORT ARTHUR, TX | 2,135 | 20.8% | 13.8% | 22.9% |
| GARY, IN | 6,462 | 20.7% | 14.2% | 22.3% |
| ATLANTA-SANDY SPRINGS-ALPHARETTA, GA | 50,499 | 20.4% | 14.5% | 21.0% |
| PHILADELPHIA, PA | 14,602 | 20.2% | 13.2% | 17.6% |
| BARNSTABLE TOWN, MA | 562 | 20.2% | 14.2% | 7.4% |
| BALTIMORE-COLUMBIA-TOWSON, MD | 20,899 | 19.9% | 14.1% | 19.4% |
| BOSTON, MA | 4,169 | 19.8% | 13.8% | 8.3% |
| MIAMI-MIAMI BEACH-KENDALL, FL | 10,765 | 19.7% | 14.8% | 20.0% |
| SAN ANTONIO-NEW BRAUNFELS, TX | 17,881 | 19.6% | 13.0% | 19.3% |
| WEST PALM BEACH-BOCA RATON-BOYNTON BEACH, FL | 6,544 | 19.6% | 14.5% | 17.4% |
| NEW HAVEN-MILFORD, CT | 5,498 | 19.6% | 13.8% | 20.7% |
| WILMINGTON, DE-MD-NJ | 5,773 | 19.5% | 13.4% | 23.5% |
| MOBILE, AL | 3,280 | 19.5% | 12.5% | 24.3% |
| CHARLESTON-NORTH CHARLESTON, SC | 4,130 | 19.3% | 13.5% | 13.7% |
| LAS VEGAS-HENDERSON-PARADISE, NV | 13,423 | 19.3% | 14.7% | 16.9% |
| COLUMBIA, SC | 5,809 | 19.2% | 12.9% | 18.8% |
| DALLAS-PLANO-IRVING, TX | 27,517 | 19.2% | 12.9% | 14.8% |
| BIRMINGHAM-HOOVER, AL | 7,353 | 19.0% | 12.3% | 18.2% |
| FORT WORTH-ARLINGTON-GRAPEVINE, TX | 15,879 | 19.0% | 12.8% | 18.3% |
| GREELEY, CO | 2,178 | 18.8% | 13.6% | 20.7% |
| EL PASO, TX | 6,887 | 18.7% | 13.0% | 26.9% |
| WORCESTER, MA-CT | 3,748 | 18.7% | 12.8% | 15.1% |
| ORLANDO-KISSIMMEE-SANFORD, FL | 15,593 | 18.7% | 13.8% | 21.6% |
| FREDERICK-GAITHERSBURG-ROCKVILLE, MD | 5,040 | 18.6% | 14.0% | 12.7% |
| ELGIN, IL | 4,594 | 18.5% | 12.5% | 19.9% |
| SAN RAFAEL, CA | 36 | 18.5% | 14.9% | 1.6% |
| SPRINGFIELD, MA | 2,916 | 18.4% | 12.2% | 17.4% |
| LITTLE ROCK-NORTH LITTLE ROCK-CONWAY, AR | 4,989 | 18.3% | 12.8% | 16.6% |
| MEMPHIS, TN-MS-AR | 10,392 | 18.2% | 11.7% | 21.6% |
| VALLEJO, CA | 1,645 | 18.2% | 13.0% | 16.4% |
| OAKLAND-BERKELEY-LIVERMORE, CA | 3,470 | 18.1% | 13.4% | 6.1% |
| SAVANNAH, GA | 2,264 | 18.1% | 12.1% | 16.1% |
| LAKELAND-WINTER HAVEN, FL | 6,090 | 18.1% | 12.8% | 34.0% |
| OXNARD-THOUSAND OAKS-VENTURA, CA | 1,249 | 18.1% | 13.0% | 8.7% |
| URBAN HONOLULU, HI | 808 | 18.0% | 14.1% | 4.0% |
| CAMBRIDGE-NEWTON-FRAMINGHAM, MA | 3,990 | 17.9% | 12.9% | 7.5% |
| HARTFORD-EAST HARTFORD-MIDDLETOWN, CT | 7,566 | 17.9% | 12.6% | 19.5% |
| LOS ANGELES-LONG BEACH-GLENDALE, CA | 15,170 | 17.8% | 12.9% | 9.7% |
| LAKE COUNTY-KENOSHA COUNTY, IL-WI | 3,860 | 17.7% | 12.0% | 12.8% |
| CHARLOTTE-CONCORD-GASTONIA, NC-SC | 13,095 | 17.7% | 12.0% | 13.7% |
| SAN DIEGO-CHULA VISTA-CARLSBAD, CA | 4,054 | 17.5% | 13.3% | 7.0% |
| PORT ST. LUCIE, FL | 3,097 | 17.4% | 12.3% | 24.9% |
| JACKSONVILLE, FL | 8,508 | 17.4% | 12.2% | 16.1% |
| NAPLES-MARCO ISLAND, FL | 1,361 | 17.4% | 12.7% | 14.0% |
| AUGUSTA-RICHMOND COUNTY, GA-SC | 3,628 | 17.3% | 11.1% | 17.8% |
| ALBANY-SCHENECTADY-TROY, NY | 4,189 | 17.3% | 12.0% | 15.0% |
| ALLENTOWN-BETHLEHEM-EASTON, PA-NJ | 5,073 | 17.2% | 11.7% | 22.2% |
| RIVERSIDE-SAN BERNARDINO-ONTARIO, CA | 21,770 | 17.1% | 11.9% | 20.6% |
| DURHAM-CHAPEL HILL, NC | 1,809 | 17.1% | 11.3% | 8.0% |
| CLEVELAND-ELYRIA, OH | 11,560 | 17.0% | 12.0% | 17.7% |
| DETROIT-DEARBORN-LIVONIA, MI | 7,762 | 17.0% | 11.2% | 19.1% |
| AUSTIN-ROUND ROCK-GEORGETOWN, TX | 8,836 | 16.9% | 11.4% | 10.6% |
| LUBBOCK, TX | 1,968 | 16.9% | 10.9% | 19.2% |
| TACOMA-LAKEWOOD, WA | 3,939 | 16.9% | 12.1% | 16.4% |
| RALEIGH-CARY, NC | 4,969 | 16.9% | 11.5% | 8.8% |
| PROVIDENCE-WARWICK, RI-MA | 7,518 | 16.8% | 11.4% | 19.0% |
| OKLAHOMA CITY, OK | 8,812 | 16.8% | 11.5% | 18.6% |
| WICHITA, KS | 3,558 | 16.8% | 11.2% | 16.1% |
| TULSA, OK | 5,734 | 16.8% | 11.5% | 20.4% |
| MONTGOMERY COUNTY-BUCKS COUNTY-CHESTER COUNTY, PA | 6,639 | 16.7% | 11.7% | 11.7% |
| DENVER-AURORA-LAKEWOOD, CO | 11,313 | 16.7% | 11.9% | 13.9% |
| SAN JOSE-SUNNYVALE-SANTA CLARA, CA | 670 | 16.6% | 13.1% | 2.3% |
| ANAHEIM-SANTA ANA-IRVINE, CA | 2,198 | 16.6% | 13.1% | 5.3% |
| STOCKTON, CA | 2,969 | 16.6% | 11.6% | 18.0% |
| VIRGINIA BEACH-NORFOLK-NEWPORT NEWS, VA-NC | 10,195 | 16.6% | 11.2% | 14.4% |
| RICHMOND, VA | 8,310 | 16.5% | 10.9% | 17.7% |
| ST. LOUIS, MO-IL | 15,649 | 16.5% | 10.9% | 15.2% |
| GREENSBORO-HIGH POINT, NC | 3,846 | 16.5% | 10.9% | 15.3% |
| TAMPA-ST. PETERSBURG-CLEARWATER, FL | 15,459 | 16.5% | 11.9% | 19.6% |
Read More:FHA Mortgage Delinquencies Hit 17.5%. In 30 Metros, over 20%: On the Other Side of a Red-Hot Housing Market
2021-03-25 03:37:37