New Zealand Dollar Outlook:
- The New Zealand Dollar is approaching critical support, which if broken, points to more losses in the near-term.
- NZD/JPY rates are testing the uptrend from the March 2020 and January 2022 lows, while NZD/USD rates just set fresh monthly and yearly lows.
- Nevertheless, according to the IG Client Sentiment Index, the New Zealand Dollar has a bullish bias in the near-term.
Recommended by Christopher Vecchio, CFA
Get Your Free Top Trading Opportunities Forecast
Fundamentals Deteriorate
Sagging global growth conditions and a weakening domestic economy are weighing on the New Zealand Dollar, which no longer enjoys a relative yield advantage now that several other major central banks have caught up to the Reserve Bank of New Zealand. The New Zealand Citi Economic Surprise Index, a gauge of economic data momentum, has been slowly eroding in recent weeks, from -2.2 on September 15 to -5.9 today.
Amid a deterioration in risk appetite, the two major NZD-crosses have exhibited fresh signs of meaningful technical weakness. NZD/JPY rates are testing the uptrend from the March 2020 and January 2022 lows, while NZD/USD rates just set fresh monthly and yearly lows. In both cases, losing support suggests that more weakness lies ahead.
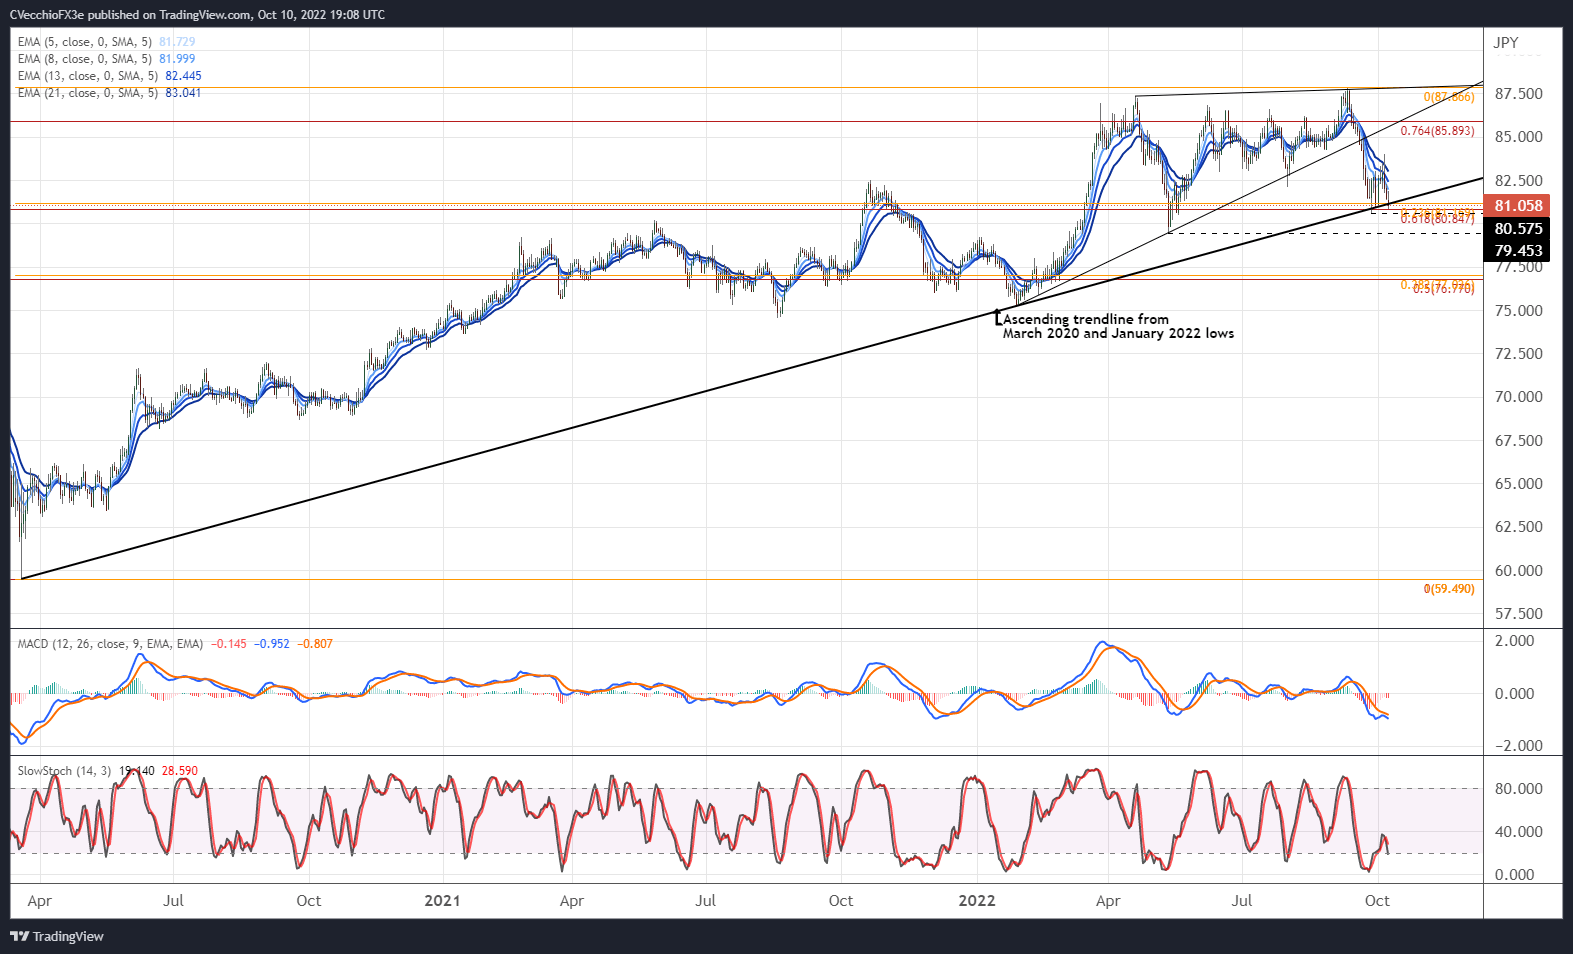
NZD/JPY RATE TECHNICAL ANALYSIS: DAILY CHART (March 2020 to October 2022) (CHART 1)
NZD/JPY rates are still falling after breaching bearish rising wedge support at the end of September. The pair is approaching an area of significant technical support: the September low at 80.56; the rising trendline from the March 2020 and January 2020 lows; the 23.6% Fibonacci retracement of the 2020 low/2022 high range at 81.17; and the 61.8% Fibonacci retracement of the 2015 high/2022 low range at 80.75.
Momentum is bearish at present time. NZD/JPY rates are below their daily 5-, 8-, 13-, and 21-EMA envelope, which is in bearish sequential order. Daily MACD is declining while below its signal line, and daily Slow Stochastics are falling towards oversold territory. A drop through the support area around 80.56/81.17 would suggest a more significant sell off is yet to come.
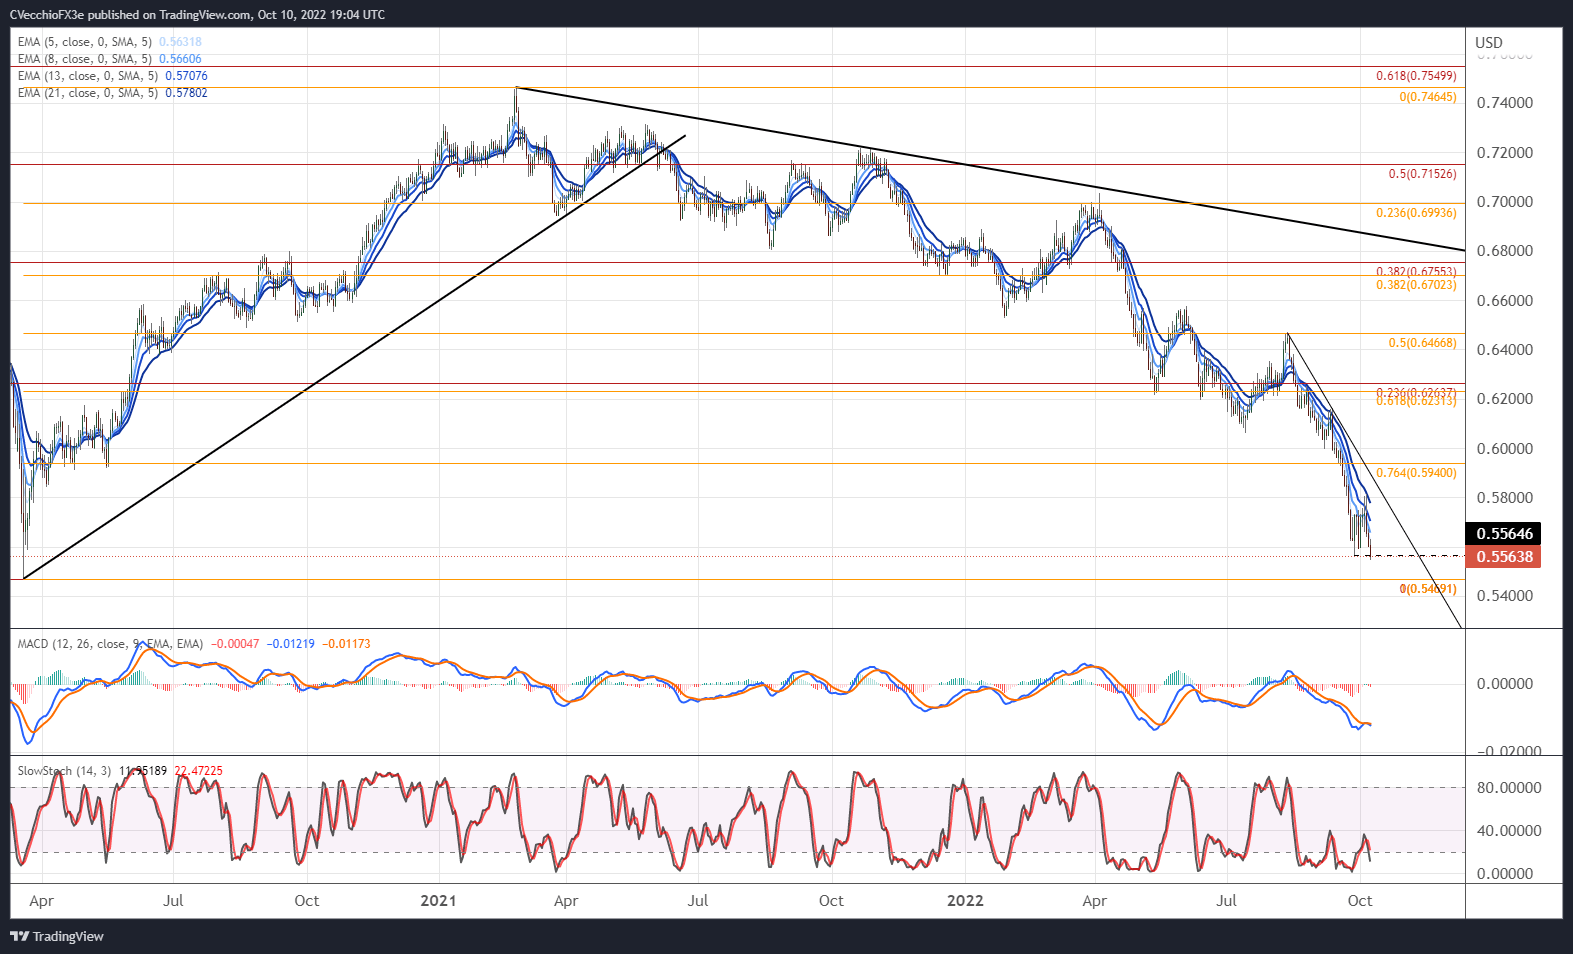
NZD/USD RATE TECHNICAL ANALYSIS: DAILY CHART (March 2020 to October 2022) (CHART 2)
NZD/USD rates hit a fresh monthly and yearly low during today’s session by breaching the September low at 0.5565. Momentum remains bearish. The pair is below its daily 5-, 8-, 13-, and 21-EMA envelope, which is in bearish sequential order. Daily MACD is declining while below its signal line, and daily Slow Stochastics are back in oversold territory. A deeper setback to the March 2020 low at 0.5469 can’t be ruled out in the near-term.
IG Client Sentiment Index: NZD/USD RATE Forecast (October 10, 2022) (Chart 3)
NZD/USD: Retail trader data shows 71.11% of traders are net-long with the ratio of traders long to short at 2.46 to 1. The number of traders net-long is 9.09% higher than yesterday and 10.98% higher from last week, while the number of traders net-short is 26.83% higher than yesterday and 39.29% higher from last week.
We typically take a contrarian view to crowd sentiment, and the fact traders are net-long suggests NZD/USD prices may continue to fall.
Yet traders are less net-long than yesterday and compared with last week. Recent changes in sentiment warn that the current NZD/USD price trend may soon reverse higher despite the fact traders remain net-long.
Trade Smarter – Sign up for the DailyFX Newsletter
Receive timely and compelling market commentary from the DailyFX team
Subscribe to Newsletter
— Written by Christopher Vecchio, CFA, Senior Strategist
Read More:New Zealand Dollar Technical Analysis: NZD/JPY, NZD/USD Rates Outlook
2022-10-10 20:00:00