Gold Technical Price Outlook: XAU/USD Near-term Trade Levels
Gold prices plunged nearly 4% since the start of the week with XAU/USD threatening a steeper sell-off after breaking key support last month. The July battle-lines have been drawn with the bears now targeting downtrend support. These are the updated targets and invalidation levels that matter on the XAU/USD technical charts this week.
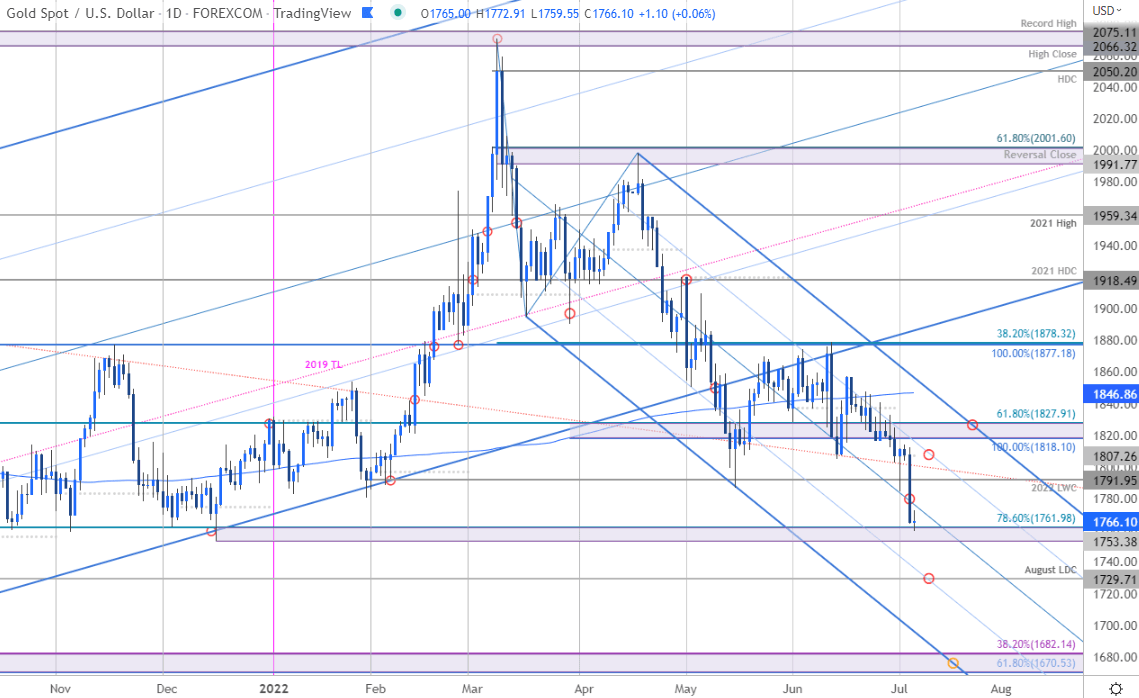
Gold Price Chart – XAU/USD Daily
Chart Prepared by Michael Boutros, Technical Strategist; Gold on Tradingview
Technical Outlook: In last month’s Gold Price Outlook we noted that XAU/USD was trading, “just above technical support at 1818/27. From a trading standpoint, last week’s outside reversal candle does put a bearish tone on XAU/USD but a break / close below this threshold is still needed to mark resumption of the broader downtrend.” It took a few days, but a break into the close of June fueled a leg lower in price with Gold plunging into a support pivot today at the December low / 78.6% Fibonacci retracement of the 2021 rally at 1753/61- the focus is on a daily close below this threshold to keep the immediate short-bias viable.
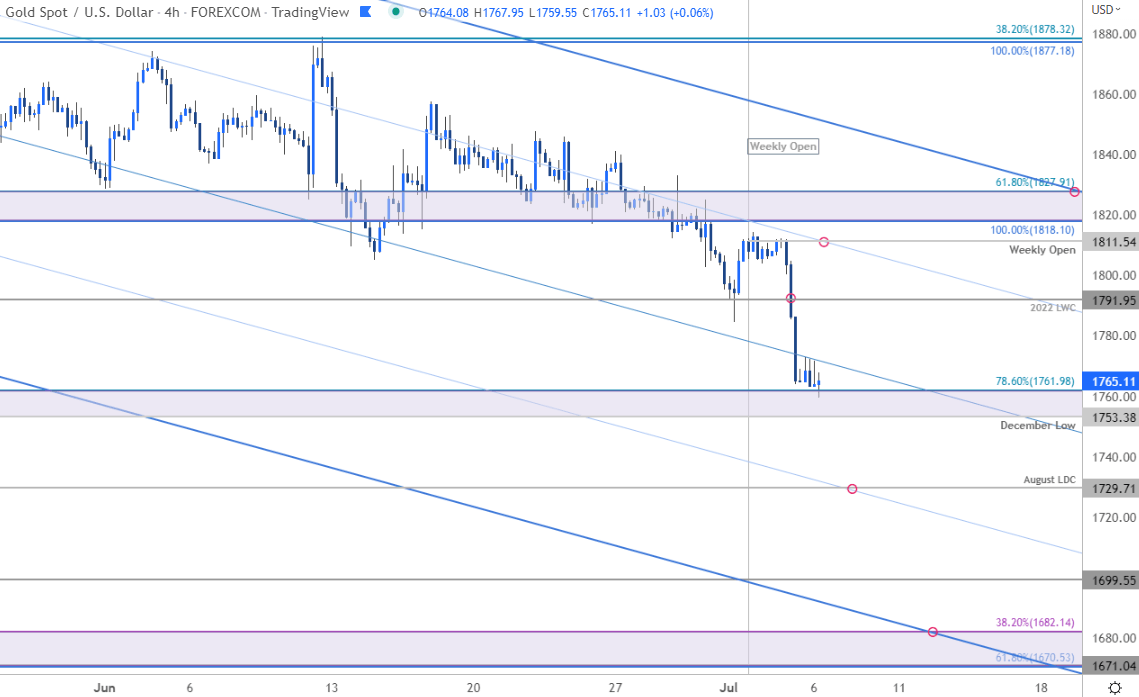
Gold Price Chart – XAU/USD 240min
Notes: A closer look at Gold price action shows XAU/USD breaking below the median-line yesterday with price now sitting at the 1853/65support zone- looking for possible price inflection here. A break lower exposes subsequent objectives at the August low-day close (1729), 1700 and the next major support zone at the 1670/82 Fibonacci confluence – look for a larger reaction there IF reached. Initial resistance now eyed at the median-line backed by January low-day close at 1791 and the weekly open at 1811. Key resistance / bearish invalidation now lowered to 1818/27.
Bottom line: Gold prices have broken to fresh yearly lows and remain at risk for further losses in the days ahead. From a trading standpoint, look to reduce short-exposure / lower protective stops on a stretch towards the lower parallels – rallies should be limited to the monthly open (1807) IF price is heading lower on this stretch. Keep in mind we are just now setting the monthly opening-range with US Non-Farm Payrolls on tap Friday- stay tuned! Review my latest Gold Weekly Price Outlook for a closer look at the longer-term XAU/USD technical trading levels.
For a complete breakdown of Michael’s trading strategy, review his Foundations of Technical Analysis series on Building a Trading Strategy
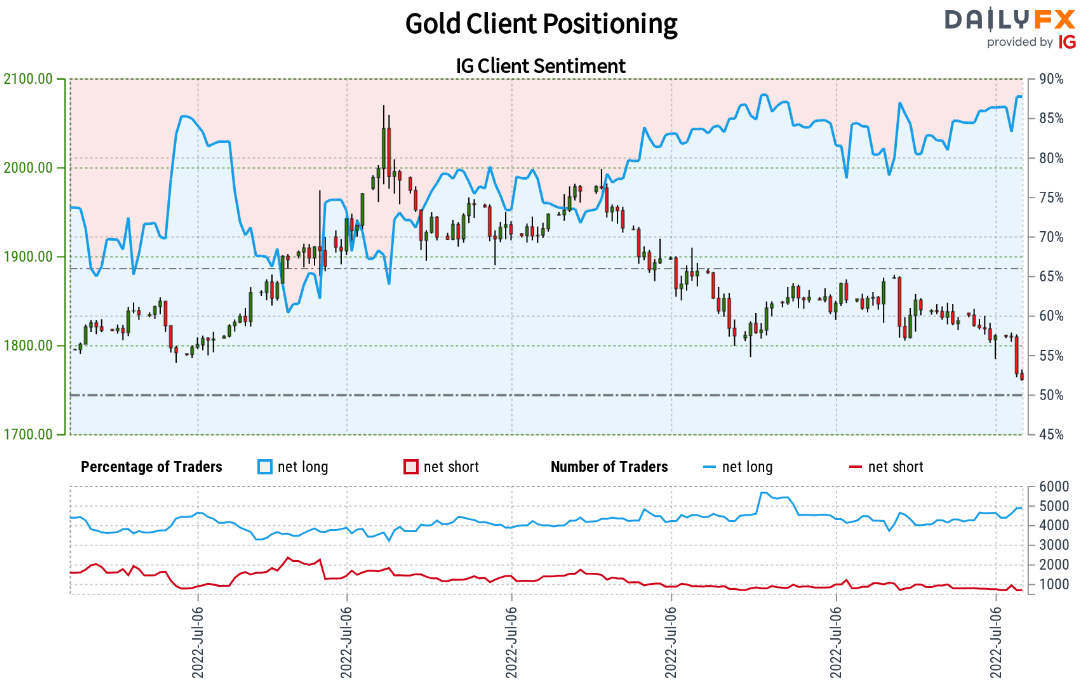
Gold Trader Sentiment – XAU/USD Price Chart
- A summary of IG Client Sentiment shows traders are net-long Gold- the ratio stands at +6.06 (85.83% of traders are long) – typically bearishreading
- Long positions are6.15% higher than yesterday and 4.47% higher from last week
- Short positions are15.59% lower than yesterday and 2.54% lower from last week
- We typically take a contrarian view to crowd sentiment, and the fact traders are net-long suggests Gold prices may continue to fall. Traders are further net-long than yesterday and last week, and the combination of current positioning and recent changes gives us a stronger Gold-bearish contrarian trading bias from a sentiment standpoint.
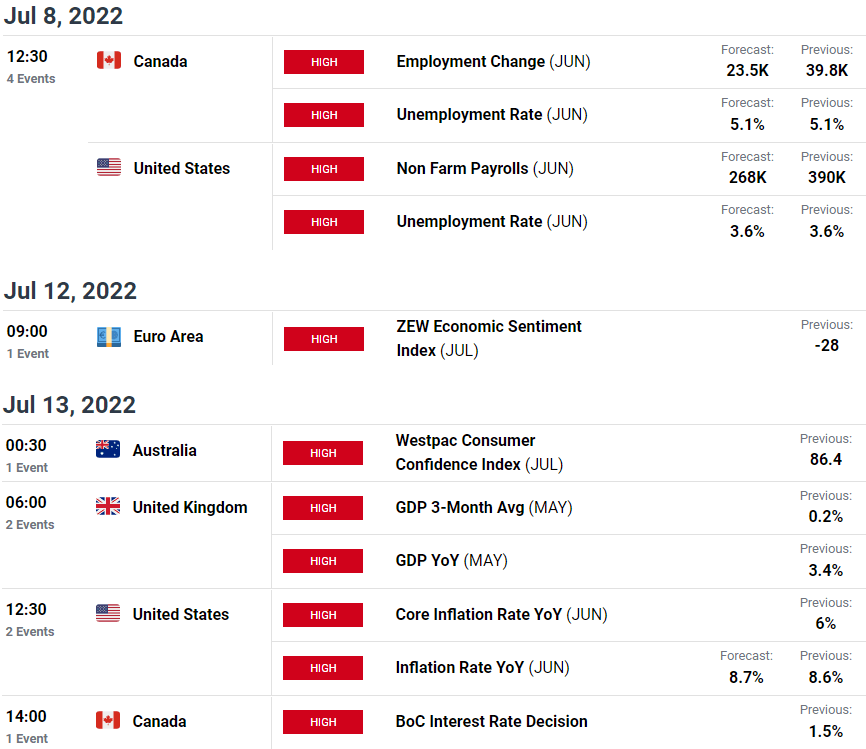
Economic Calendar
Economic Calendar – latest economic developments and upcoming event risk.
– Written by Michael Boutros, Technical Strategist with DailyFX
Follow Michael on Twitter @MBForex
Read More:Gold Price Plunge Continues into July
2022-07-06 16:00:00