Swiss Franc Technical Forecast – Talking Points
- USD/CHF faces resistance, but momentum appears primed for more upside
- GBP/CHF rally set for higher ground if the 78.6% Fib level is overtaken
- NZD/CHF may return to test the 200-week moving average after big run
Recommended by Thomas Westwater
Get Your Free Top Trading Opportunities Forecast
USD/CHF Technical Outlook
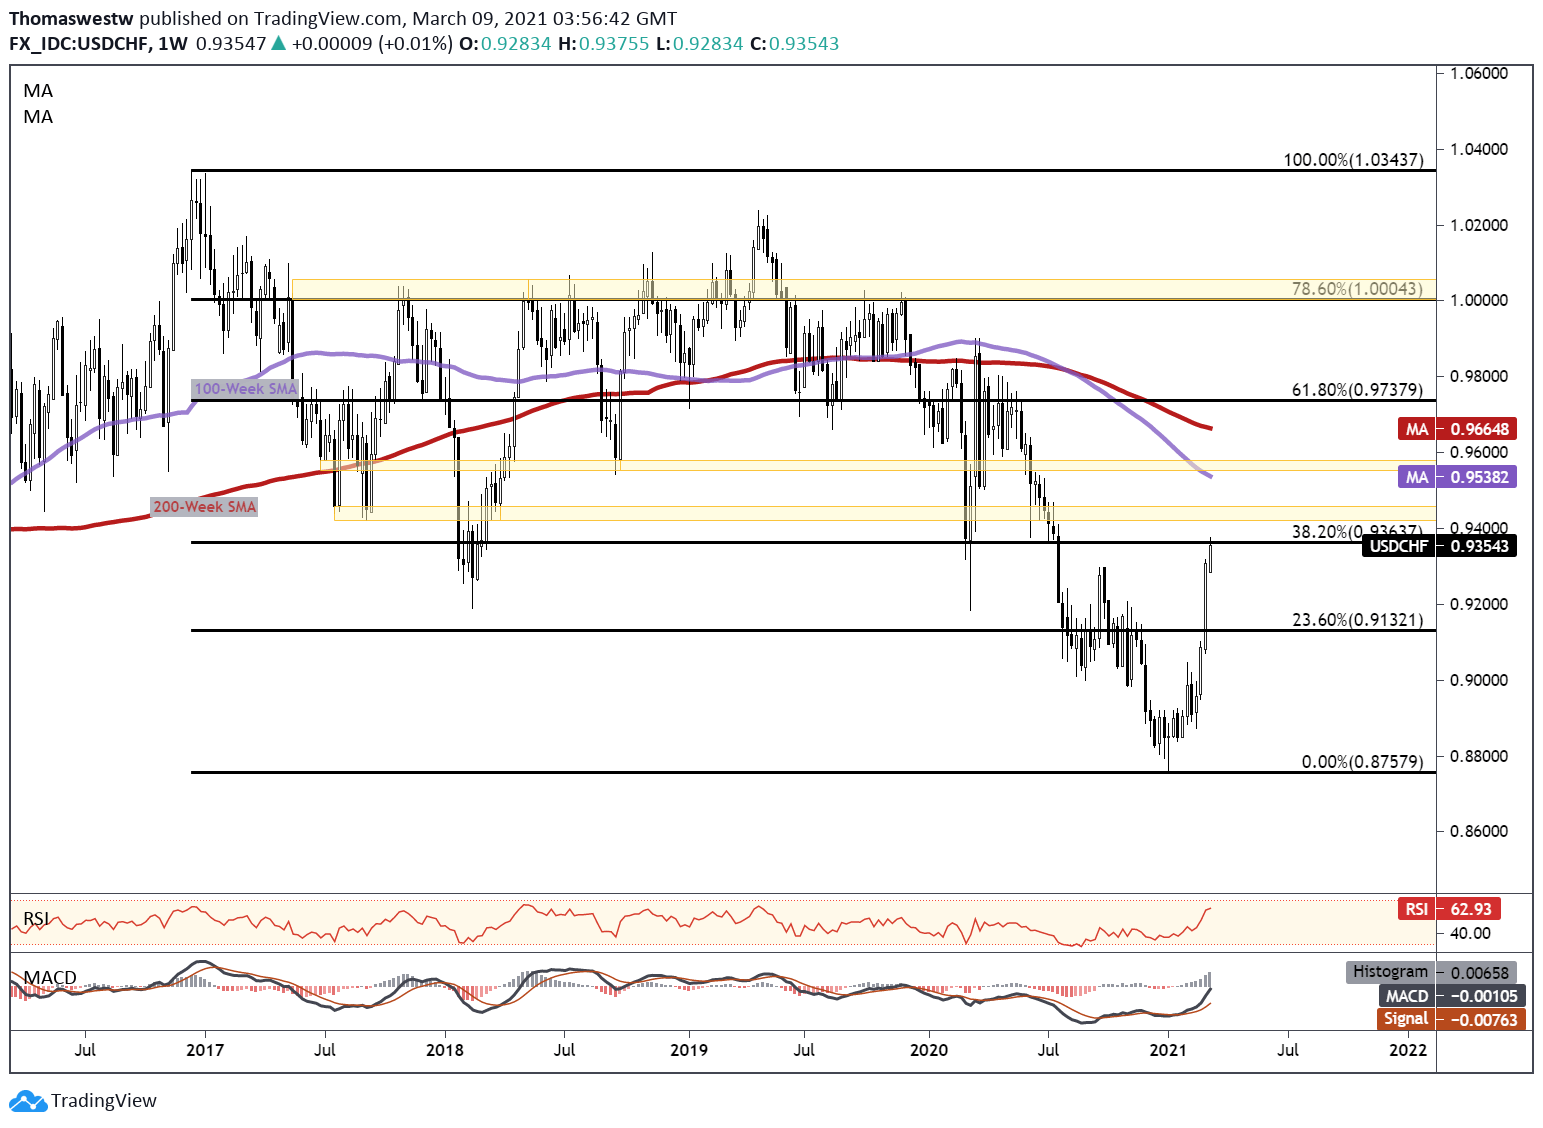
The US Dollar has been on an absolute tear versus the Swiss Franc this year, with USD/CHF up nearly 6% since the start of January. However, the cross may be due for a short-term pullback with prices now facing a major Fibonacci level and area of price confliction. Prices are now testing the 38.2% Fibonacci retracement level from the 2016 swing high to 2021 low.
While underlying Greenback strength may likely persist, the 0.9400 psychological handle – which sits just above the 38.2% Fib – offers another key level the cross will need to overtake before moving higher. Above that sits a major area of price inflection seen from 2017 to 2020. A rising MACD is on track to make a bullish cross above its center line which could bolster short-term momentum and send the pair higher. Alternatively, a move lower would see the recently overtaken 200-week Simple Moving Average shift back into focus.
USD/CHF Weekly Price Chart
Chart created with TradingView
GBP/CHF Technical Outlook:
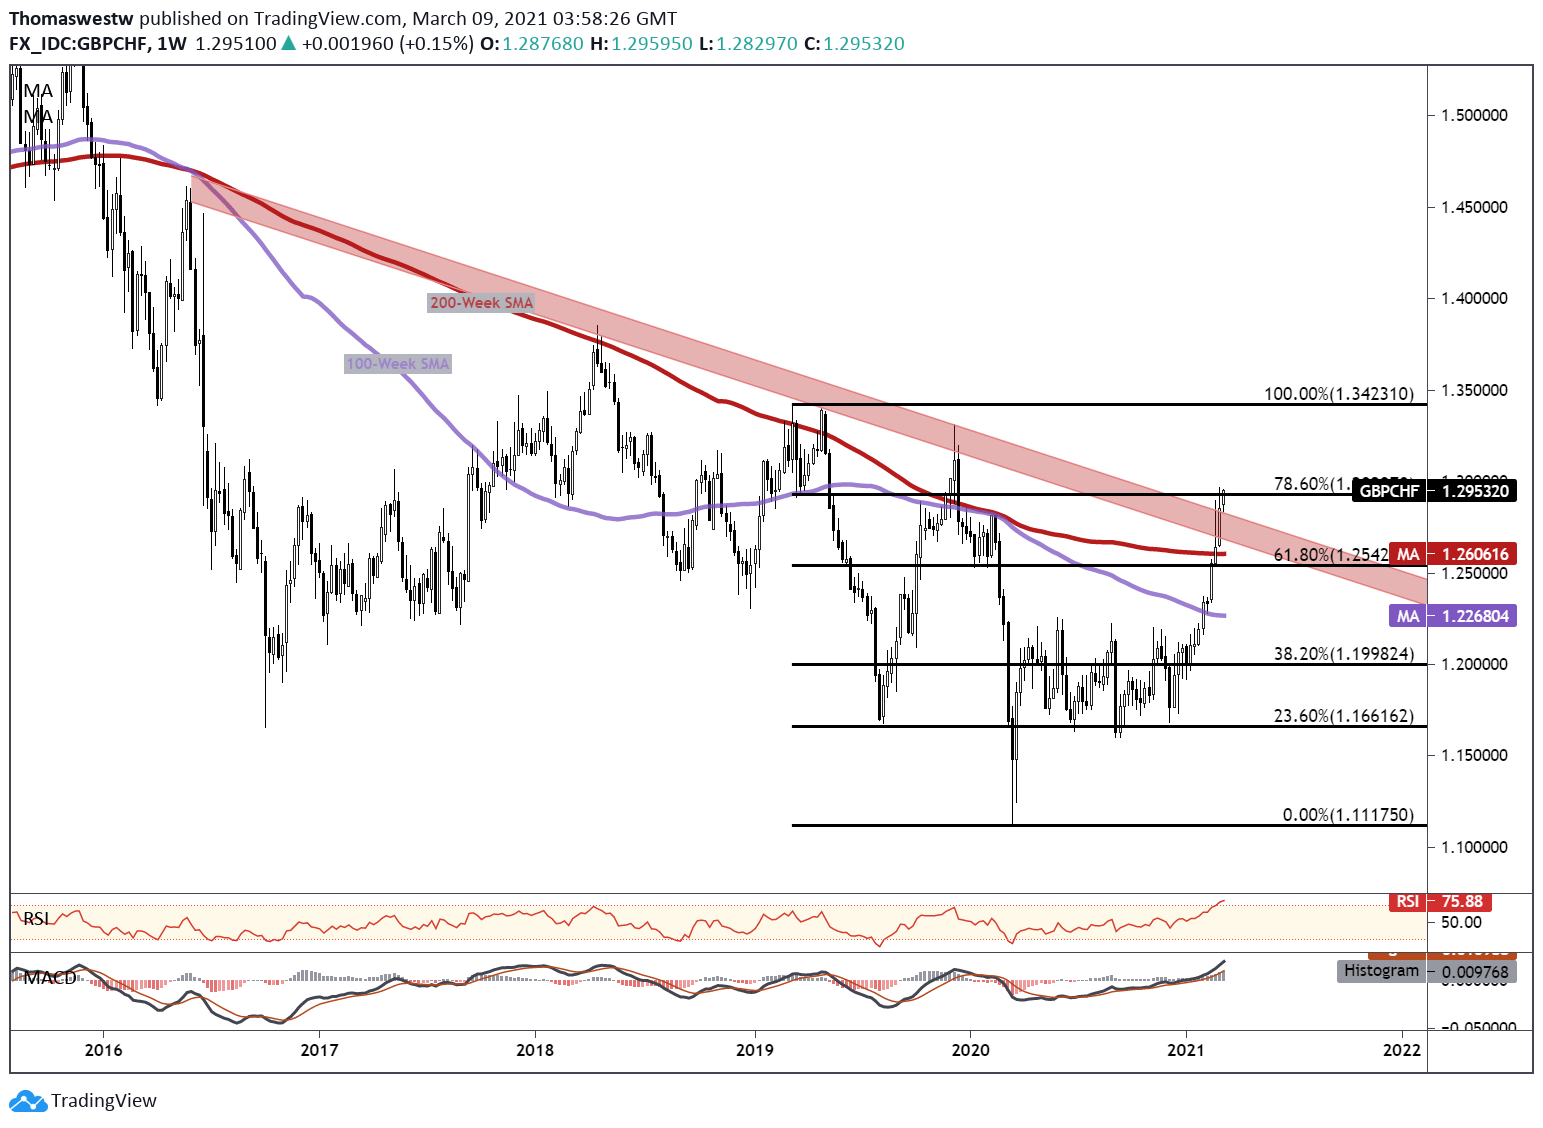
The Swiss Franc has given up considerable ground against the British Pound this year. GBP/CHF is now facing a key Fibonacci level as it trades in overbought territory. On the weekly timeframe, the cross breached trendline resistance and is now testing the 78.6% 2019-2020 Fibonacci retracement level.
Now at multi-decade overbought levels — according to the Relative Strength Index (RSI) — GBP/CHF may face a tougher march higher. Still, the MACD oscillator continues to show healthy momentum. If prices break above the Fib level, bulls could take aim at the 1.3400 psychological level which sits just below the 100% Fib retracement. A move lower would see the trendline come back into play to provide possible support.
GBP/CHF Weekly Chart
Chart created with TradingView
NZD/CHF Technical Outlook
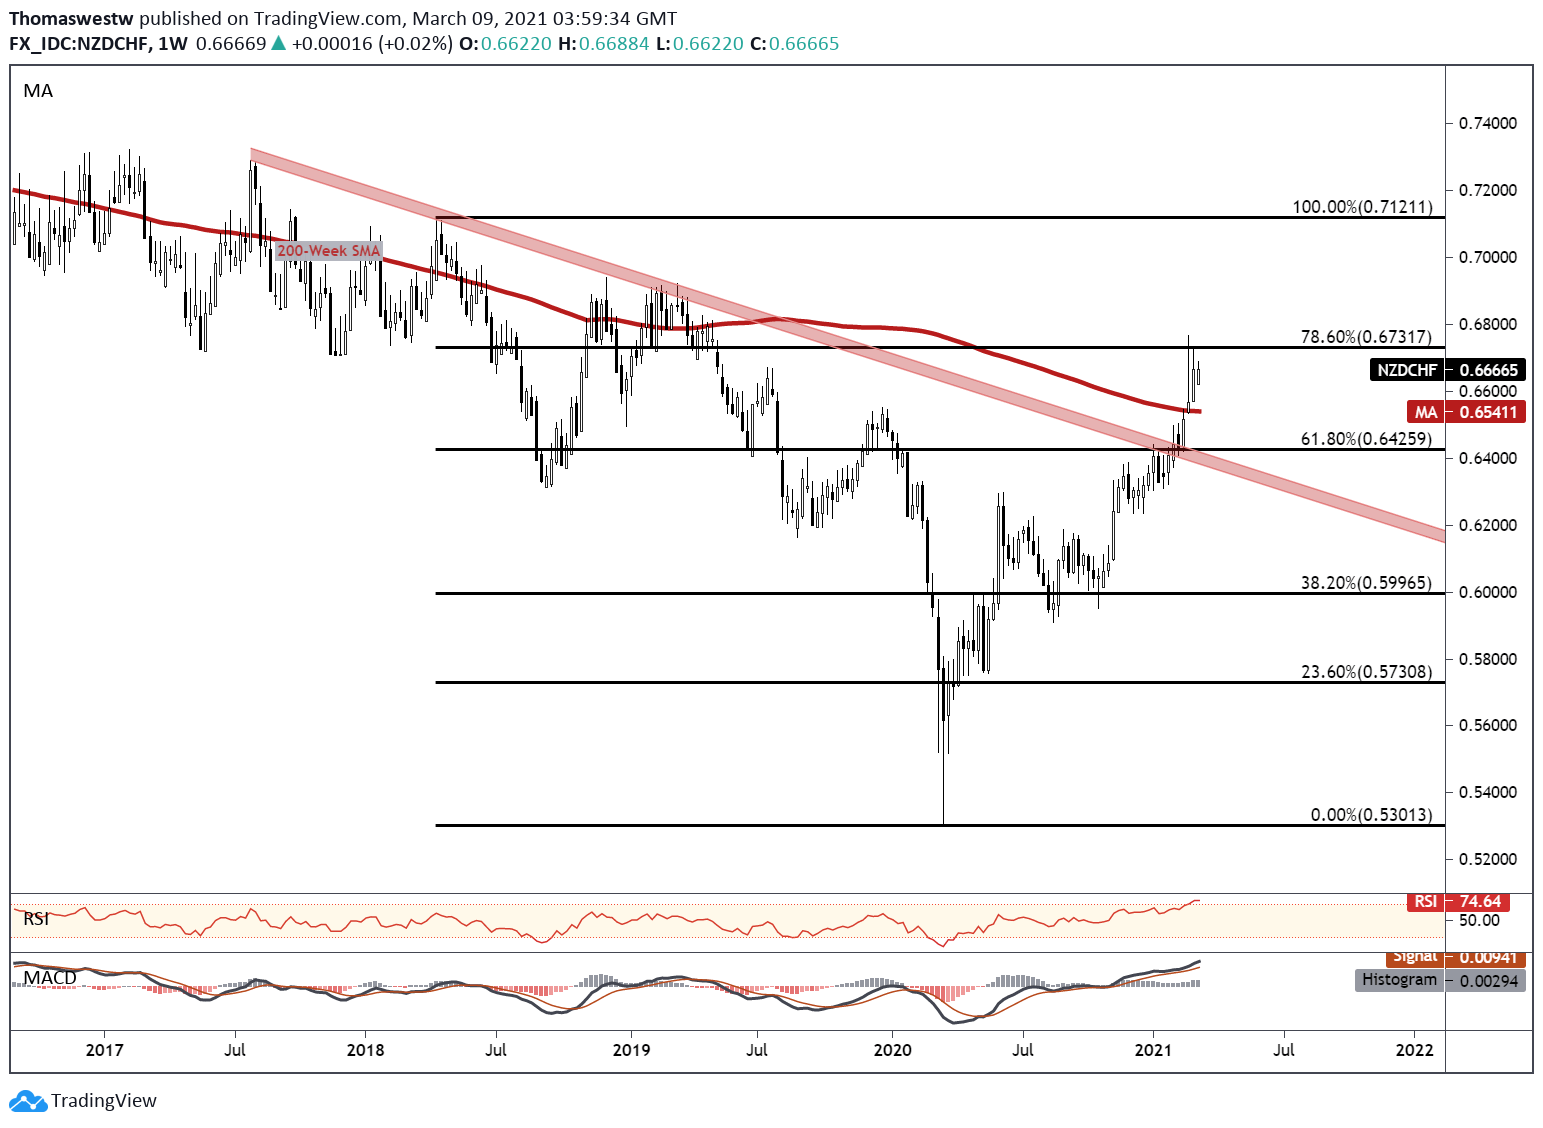
In line with the theme against the US Dollar and British Pound, NZD/CHF has seen significant gains this year. The Kiwi pierced its 200-week Simple Moving Average versus the Franc in February. Prices have since moved up to test the 78.6% Fibonacci retracement level from the 2018 swing high to 2020 swing low.
Despite recent upside momentum, a major Fib level appears to be offering resistance against further upside. The MACD oscillator remains bullishly positioned and prices could quickly return to retest the Fib level. Alternatively, a move lower would look for support near the 200-week SMA. Below that and prices would likely fall to a major trendline from 2017, which may offer a more major level of support.
NZD/CHF Weekly Chart
Chart created with TradingView
Swiss Franc TRADING RESOURCES
— Written by Thomas Westwater, Analyst for DailyFX.com
To contact Thomas, use the comments section below or @FxWestwateron Twitter
Read More:USD/CHF, GBP/CHF, NZD/CHF Weekly Chart Setups
2021-03-09 04:59:46