
Now they’re wondering why.
By Wolf Richter for WOLF STREET.
Home prices skyrocketed by the double digits starting last summer, despite the loss of 10 million jobs still, and with 2.5 million mortgages still in forbearance, as mortgage rates dropped from historic low to historic low. People bought homes without putting their old and now vacant home on the market because it’s profitable to hold it, amid surging home prices and low interest rates and the possibility of yanking cash out of the old house via a refi. As homes got grabbed and sales surged, other homes weren’t put on the market, inventory for sale plunged, and prices surged. But now, sales have turned from a preliminary dip late last year to a big drop in February. And everyone is wondering why.
In February, sales of existing homes – single-family houses, condos, and co-ops – dropped by 6.6% from January to a seasonally adjusted annual rate of 6.22 million homes, the National Association of Realtors reported today. On a year-over-year basis, sales in September through January had been up in a range from 19% to 24.4%. In February, the year-over-year increase was down to 9.1% (data via YCharts):
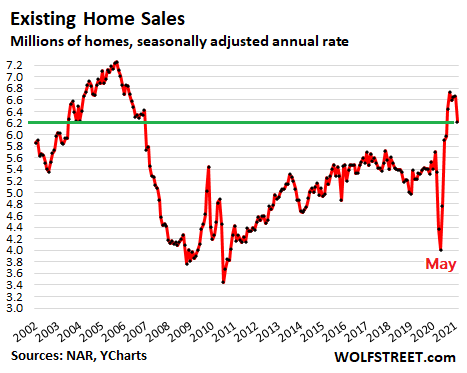
Now everyone is wondering why sales dropped.
Rising mortgage rates and the affordability issues that come from the dual impact of surging home prices and rising mortgage rates are on top of the list. But note that many of the home sales that closed in February went into contract before February, and that in January, mortgage rates had just started to rise from record lows at the end of the year. And we haven’t even seen the impact in the data of the jump in mortgage rates in late February and so far in March.
The inventory of homes for sale plunged to a record low in the data series in January of 1.03 million units, and stayed there in February, representing 2.0 months’ supply at the current rate of sales (up from 1.9 months in January).
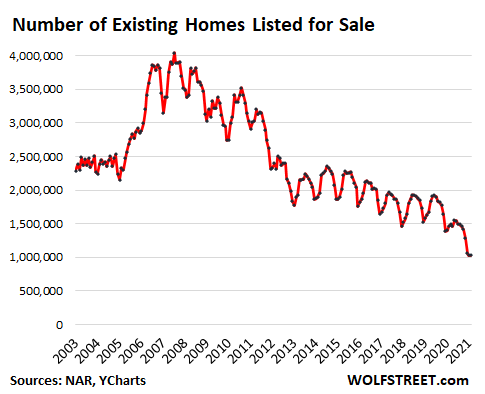
Why the 12-year-long decline in inventory for sale? There has been a structural change: the business of selling homes has changed. It used to take months to sell a home, from the moment the home got listed in a paper publication to the day the sale closed, involving a lot of personal contact and paperwork. Now homes instantly appear in the listings and are marketed online; potential buyers can tour the home via video. Mortgage approvals are largely automated and lightning fast. So the period that homes sit on the market waiting for the processes to occur has shortened. This reduces the inventory for sale. During the Pandemic, technology has invaded home sales with a quantum leap and sped up the processes.
The shadow inventory: Empowered by low mortgage rates and surging home prices, people who buy a home feel no urge to sell the old home. They can just hold the vacant home and profit from the current price increases that far outrun the carrying costs. In addition, they can refinance the mortgage and take cash out of the vacant home, while speculating on further price increases. I personally know several people who have done this as part of their financial calculus.
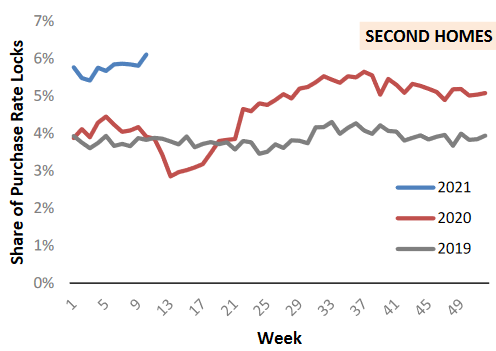
The share of second-home purchases as percent of total home purchases has soared to over 6%, a high in the data series by the AEI’s Housing Center, and far above the prior two years at this time. Some of these may be vacation homes, others may be part of the urban exit, with people simply not selling their old homes:
Mortgages in forbearance are still a big factor. According to the Mortgage Bankers’ Association, 2.5 million mortgages, or 5.1% of all mortgages, are still in forbearance, meaning that lenders have agreed not to execute their right to foreclose, thus allowing the borrower to skip mortgage payments. Many of these mortgages were already delinquent when they entered forbearance.
“Forbearance” doesn’t mean “forever,” though it may now appear that way, given the repeated extensions. The exit from forbearance can take various ways, including putting the home on the market and selling it to pay off the mortgage.
Prices upend historic seasonality.
The median price for all existing homes jumped by 15.8% year-over-year to $313,000, according to the NAR’s report. This was up 46.5% from five years ago. By home type: for a single-family house, the median price jumped by 16.2% year-over-year to $317,100; and for condos, it jumped by 12.3% to $280,500 (data via YCharts):
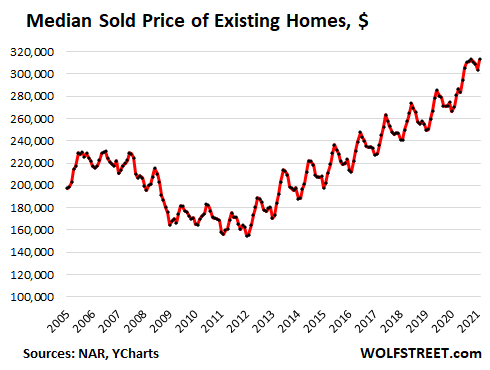
As in so many other economic indicators, the well-established seasonality of the median home price has been nixed during the Pandemic. It the past, it would peak in June or July (the high points in the chart above), and it did so even during the Housing Bust, and then it would drop and hit the seasonal low point in January or February. But in 2020, the median price hit a high in October, then dipped from November through January, and in February bounced back to the October level.
The Fed smiles upon rising long-term Treasury yields as sign of economic growth and rising inflation expectations. Read... First Signs that Surging Mortgage Rates Are Dialing Down the Heat under the Housing Market
Enjoy reading WOLF STREET and want to support it? Using ad blockers – I totally get why – but want to support the site? You can donate. I appreciate it immensely. Click on the beer and iced-tea mug to find out how:

Would you like to be notified via email when WOLF STREET publishes a new article? Sign up here.
![]()
Read More:Everyone Knows the Housing Market Craziness Can’t Last, then the First Dip Turns into a Big Drop
2021-03-23 07:56:34